
Appendix 1—figure 10. Illustration of the procedure used to estimate the time of seroreversion for each repeat blood donor.
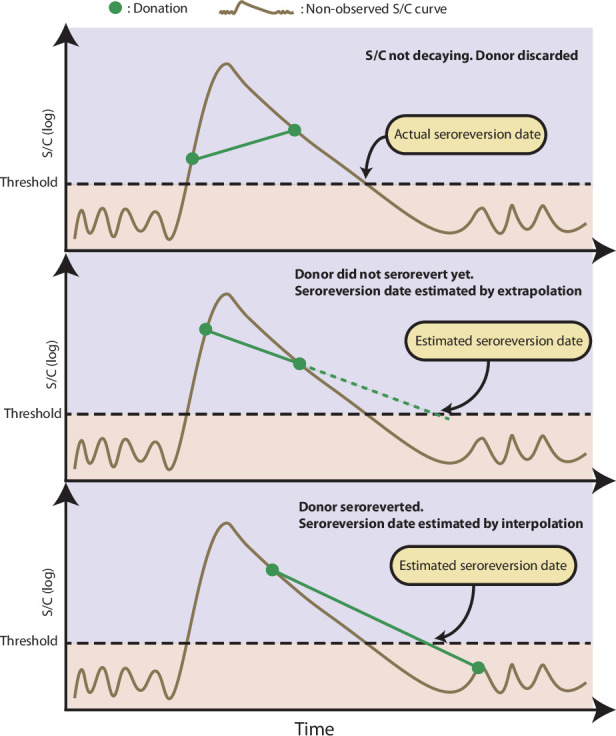
This figure shows three donors with the same idealized signal-to-cutoff (S/C) curve but different donation dates. The first donor was discarded because the observed S/C was rising. The second donor did not become negative yet after seroconversion, thus the seroreversion date is estimated by extrapolating an exponential curve that contains the last two positive results. The third donor became negative after seroconversion; hence, the seroreversion date was estimated by applying an exponential interpolation that contains the last positive result and the first negative result after seroconversion.