
FIGURE 2.
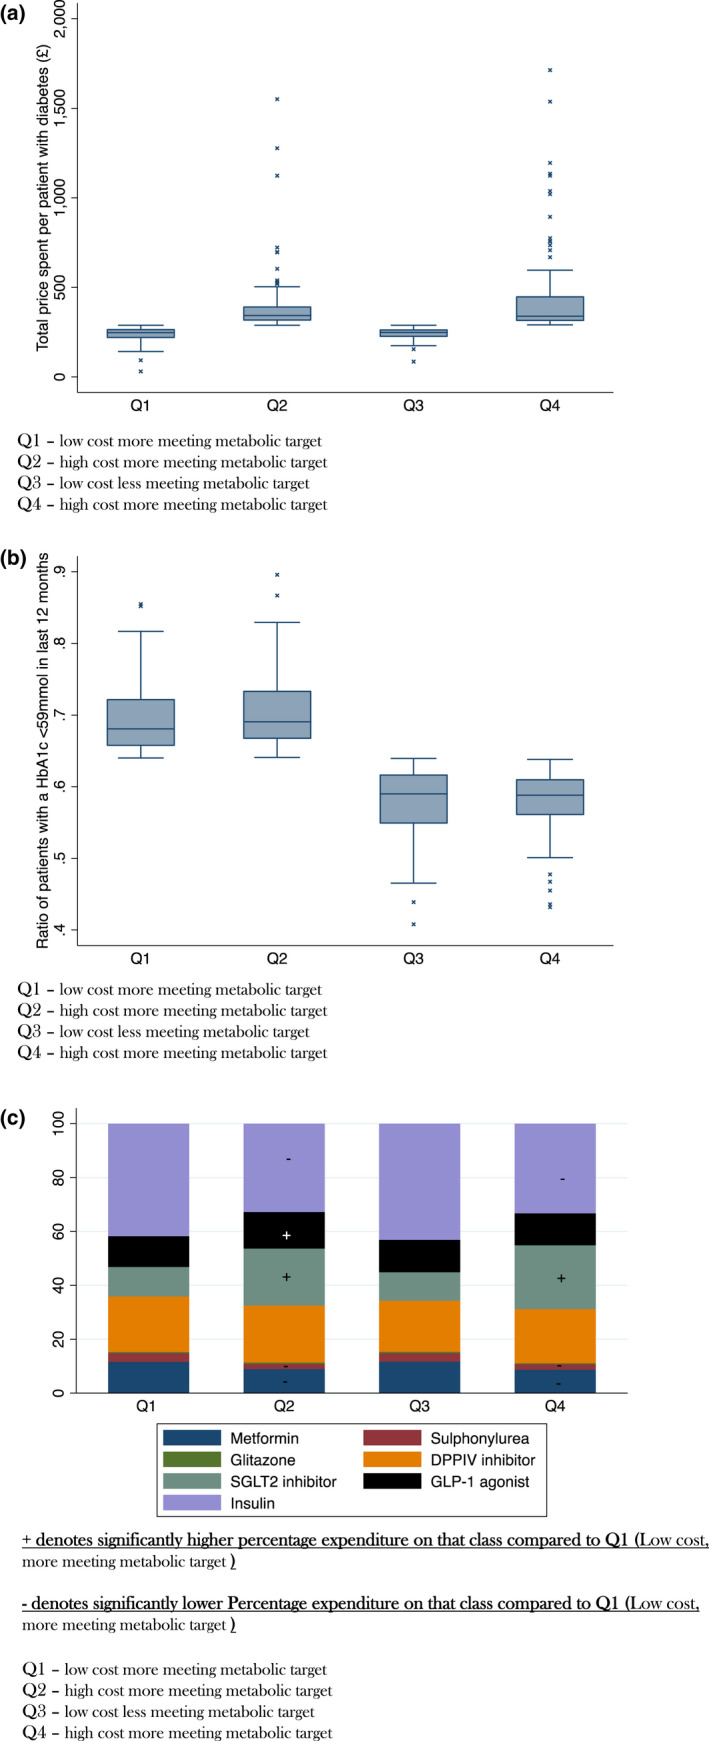
(a) Box Plot of Total cost per patient with a HbA1c by Quadrant. (b) Box Plot of proportion of patients with a HbA1c <59 mmol in the last 12 months by Quadrant. (c) Pie Chart of relative expenditure of hypoglycaemic agent class by Quadrant
Official websites use .gov
A
.gov website belongs to an official
government organization in the United States.
Secure .gov websites use HTTPS
A lock (
) or https:// means you've safely
connected to the .gov website. Share sensitive
information only on official, secure websites.
(a) Box Plot of Total cost per patient with a HbA1c by Quadrant. (b) Box Plot of proportion of patients with a HbA1c <59 mmol in the last 12 months by Quadrant. (c) Pie Chart of relative expenditure of hypoglycaemic agent class by Quadrant