
FIGURE 4.
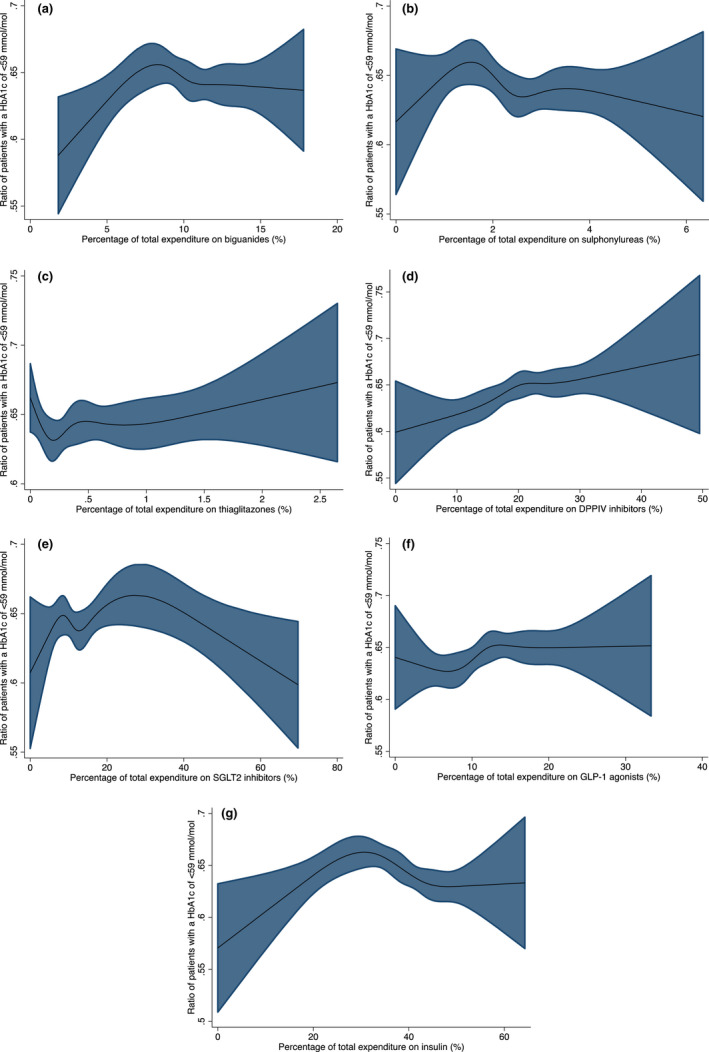
(a) Proportion of Patients with a HbA1c <59 mmol/mol by the percentage of total expenditure on biguanides. (b) Proportion of Patients with a HbA1c <59 mmol/mol by the percentage of total expenditure on sulphonylureas. (c) Proportion of Patients with a HbA1c <59 mmol/mol by the percentage of total expenditure on thiaglitazones. (d) Proportion of Patients with a HbA1c <59 mmol/mol by the percentage of total expenditure on DPPIV inhibitors. (e) Proportion of Patients with a HbA1c <59 mmol/mol by the percentage of total expenditure on SGLT2 inhibitors. (f) Proportion of Patients with a HbA1c <59 mmol/mol by the percentage of total expenditure on GLP‐1 agonists. (g) Proportion of Patients with a HbA1c <59 mmol/mol by the percentage of total expenditure on insulin