FIGURE 1.

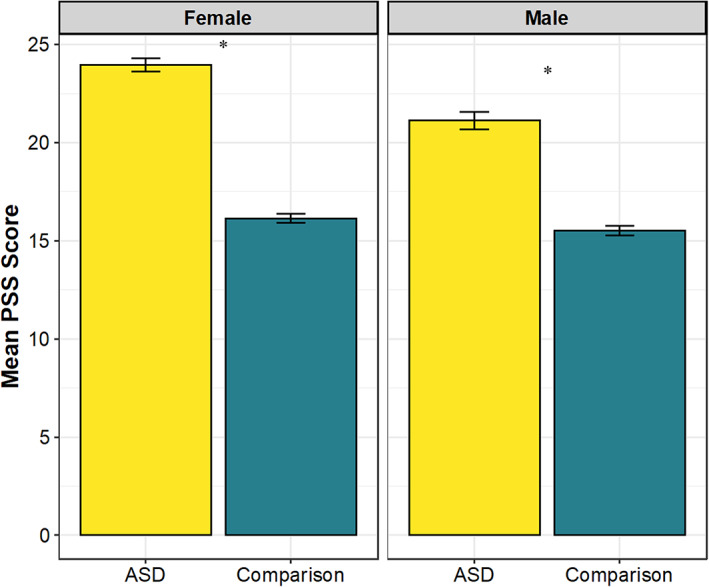
Mean 10‐item Perceived Stress Scale (PSS) scores in current ASD sample and comparison general population data (Cohen & Janicki‐Deverts, 2012), by sex designated at birth. Error bars represent standard error of the mean. *p < 0.0001

Mean 10‐item Perceived Stress Scale (PSS) scores in current ASD sample and comparison general population data (Cohen & Janicki‐Deverts, 2012), by sex designated at birth. Error bars represent standard error of the mean. *p < 0.0001