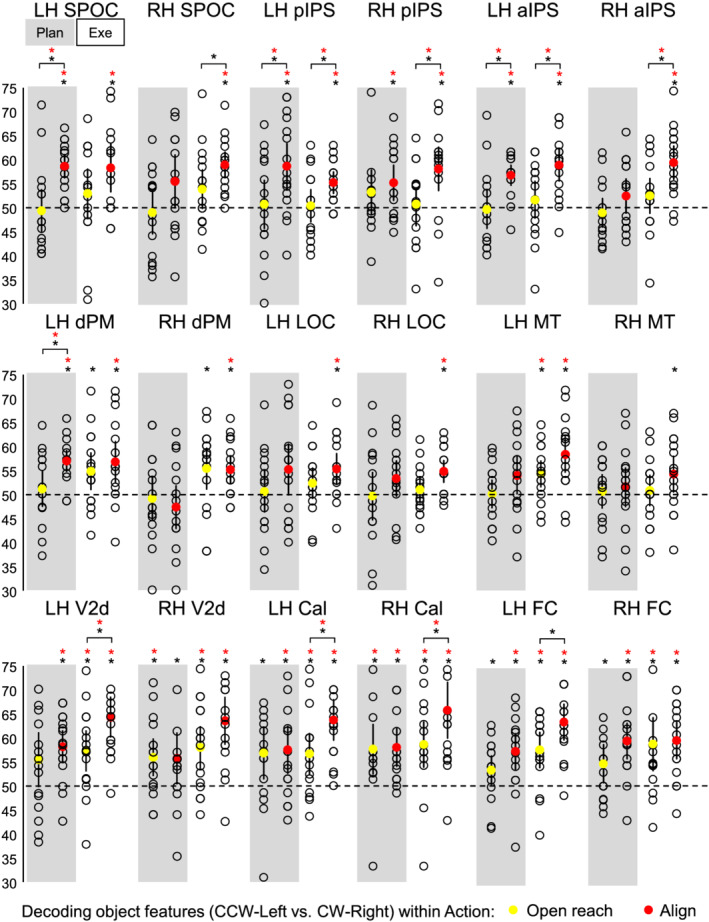
FIGURE 4.

Classifier decoding accuracies for the discrimination between object features in our ROIs within Action type. The scatterplots show decoding accuracies for each participant along with the average (coloured circles) for the dissociation between the two oriented objects (CCW‐left vs. CW‐right) during the planning (left cluster pair) and execution phase (right cluster pair) of Open reach trials (yellow circles) and Align trials (red circles). Chance level is indicated with a dashed line at 50% of decoding accuracy. Error bars show 95% confidence intervals. Black asterisks indicate statistical significance with two‐tailed t tests across subjects with respect to 50%. Red asterisks indicate statistical significance based on an FDR correction of q < .05.
