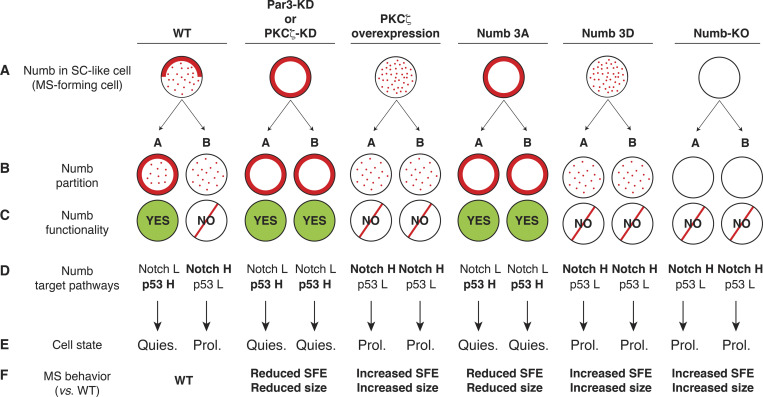
Figure 6.
A model for the effects of Numb perturbations. The cartoon shows various conditions of Numb perturbations. (A) The localization of Numb immediately before the mitosis of the MaSLC is shown (solid line, Numb associated with the PM; dots, Numb released in the cytoplasm). After mitosis, the two daughters are indicated as A and B. (B) The partition of Numb in the two daughters is shown. (C) The functionality of Numb (as the result of its phosphorylation status) is shown. (D) The effects of on the p53 and Notch pathways is shown. H, high activity; L, low activity. (E) The predicted state (Quies., quiescent; Prol., proliferating) of the two daughters is shown. Note that only in the WT condition, an asymmetric fate is obtained. (F) Prediction of the effects on MS growth.

