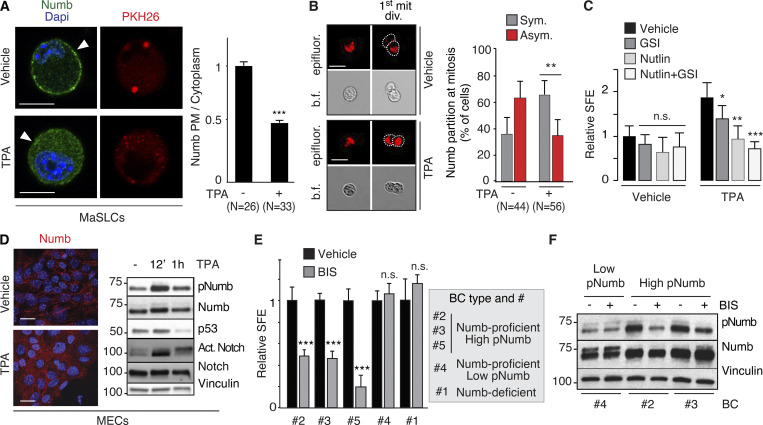
Figure 9.
PKCs and Numb phosphorylation in human BCs. (A) Left: MaSLCs (PKHpos cells) were treated with 1 μM TPA (12 min) and stained with anti-Numb and DAPI. PHK26 (red), Numb (green), DAPI (blue). Arrowheads point to PM. Bar, 10 μm. Right: Quantitation of experiment, data are expressed as the ratio between plasma membrane (PM) Numb and cytoplasmic Numb, relative to vehicle. (B) Left: Numb partitioning at mitosis of MaSLCs (1st mit. div.), treated as indicated (TPA, 1 μM for the duration of the experiment). Bar, 10 μm. b.f., bright-field.; epifluorescence (red). Right: Quantitation of the experiment, showing the frequency of symmetric (Sym) vs. asymmetric (Asym) partitioning of Numb. (C) SFE of mouse WT MECs treated as indicated (TPA treatment as in B, other drugs as in Fig. 8); data are relative to Vehicle control (see also Table S2). (D) Left: Numb confocal immunofluorescence in MECs treated with TPA as in A. Numb (red), DAPI (blue); Bar, 20 μm. Right: IB of MECs treated with TPA (1 μM) for the indicated time. (E) SFE, in the presence of BIS of the indicated BC primary cultures. (F) The indicated BC primary cultures were treated with BIS (3 μM o/n) and IB as shown. When shown: N, number of cells or doublets analyzed, as appropriate. Data are reported ± SD (B, C, and E) or ± SE (A). Statistical analysis was with the nonparametric Fisher’s exact test (B) or with the Student’s t test two-tailed (A, C, and E). Source data are available for this figure: SourceData F9.

