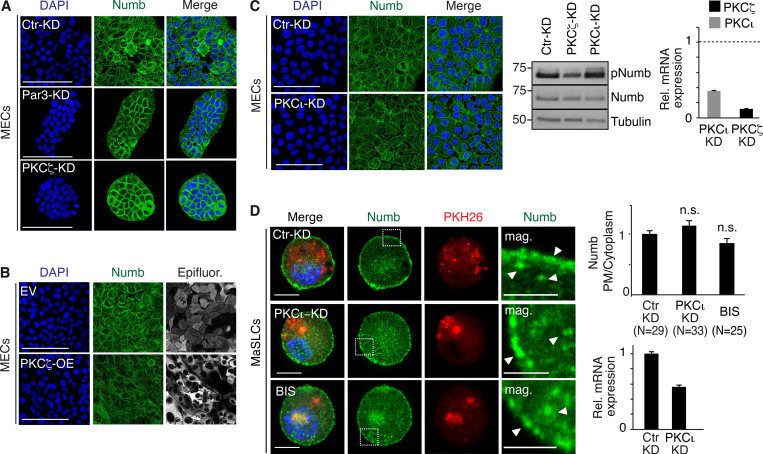
Figure S1.
Additional data to Fig. 1. (A and B) Numb confocal immunofluorescence in mouse MECs stably silenced for Par3 (Par3-KD) and PKCζ (PKCζ -KD) or mock silenced (Ctr-KD; A) or overexpressing Venus (EV) and PKCζ-Venus (PKCζ -OE; B). Numb (green, pseudocolored from Cy3 staining), epifluorescence (gray, pseudocolored from Venus, in EV, and PKCζ-Venus, in PKCζ -OE), DAPI (blue). Bars, 100 µm. (C) Left: Numb confocal immunofluorescence in mouse MECs stably silenced for PKCι (PKCι-KD). Numb (green), DAPI (blue). Bar, 100 µm. Middle: Immunoblots of Numb and pNumb in the cell lysates indicated on top. Tubulin, loading control. Right: qPCR analysis showing the efficacy of PKCι and PKCζ silencing in MaSLCs. Data are expressed relative to control cells (dashed line). (D) Numb confocal immunofluorescence. Left: MaSLCs (PKH26POS cells) from WT mammospheres (MS) stably silenced for PKCι (PKCι-KD), were stained with anti-Numb and DAPI. Control cells were also treated with 3 μm Bisindolylmaleimide I (BIS) o/n and subjected to the same IF. The boxed areas are magnified on the right. PHK26 (red), Numb (green), DAPI (blue). Bar, 10 μm. Mag, magnification (bar, 3 μm). White arrows in magnifications point to PM or cytoplasmic areas. Right (top), quantitation of the experiment. Data are expressed as ratio between plasma membrane (PM) and cytoplasmic Numb, relative to control (N, number of cells analyzed). Right (bottom), qPCR analysis showing the efficacy of PKCι silencing in MaSLCs. Data are expressed relative to control cells ± SE; statistical analysis was with the Student’s t test two-tailed. In this and all subsequent supplementary figures: P is: *, <0.05; **, <0.01; ***, <0.001. Source data are available for this figure: SourceData FS1.

