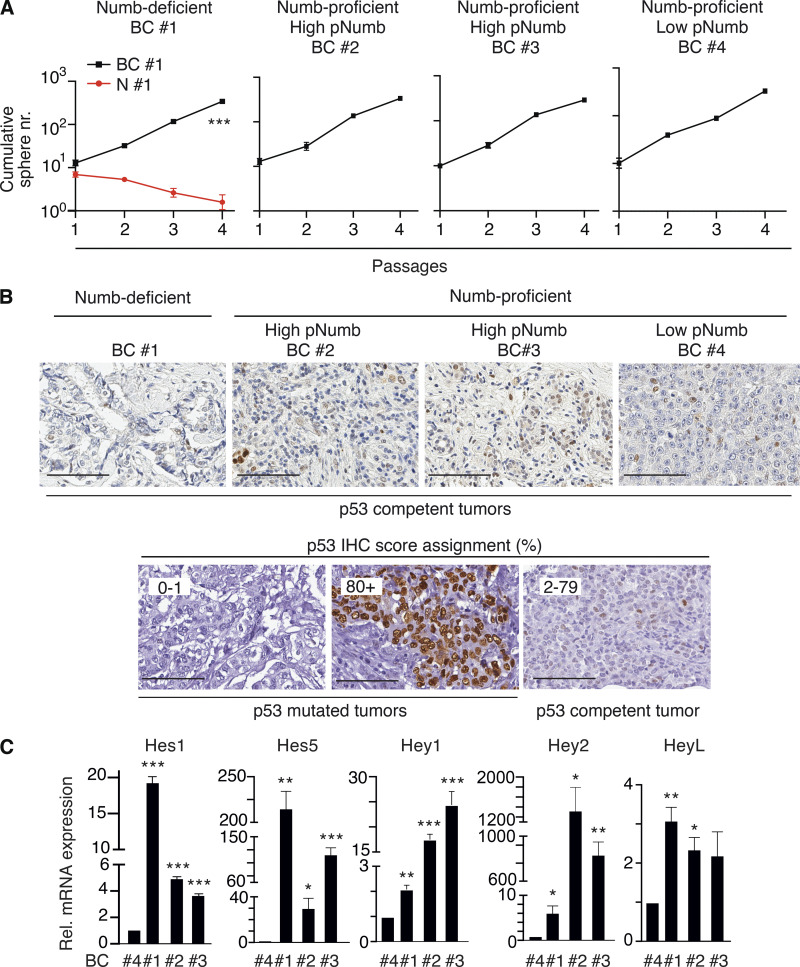
Figure S4.
Additional data to Fig. 8. (A) Serial MS assay of the cells from the BC PDXs employed in the experiments shown in Fig. 8, F and G. Results are reported ± SD. A normal counterpart of BC #1 (N#1) is also reported (red line). P, *** = < 0.001 by ANOVA test. (B) Top panels: Representative images of p53 status in FFPE samples of the BCs analyzed in Fig. 8 E. Bottom panels: The scale of p53 IHC staining used in representative BC tumors. BCs were classified into three groups according to the p53 nuclear staining (see also Materials and methods and Alsner et al., 2008; Colaluca et al., 2018; Yemelyanova et al., 2011): 0–1, 0–1% positive nuclei (indicative of complete loss of p53 protein/nonsense mutations); 2–79, 2–79% positive nuclei (indicative of WT levels of p53); 80+, positive p53 nuclei ≥80% (indicative of missense mutations of p53). Bar, 100 μm. (C) The indicated BCs (see Fig. 8 for detailed descriptions) were analyzed by qPCR for the indicated Notch pathway targets. Data are expressed (±SE) relative to mRNA levels in BC #4 (=1; BC #4 is a Numb-proficient, low-pNumb BC). In C, significance was calculated with the Student’s t test two-tailed, vs. BC #4.

