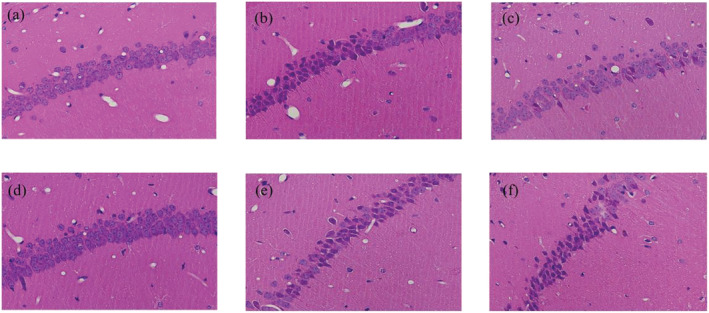
FIGURE 2.

Hematoxylin and eosin (H&E) staining shows the effect of EDB on morphological changes in the mice hippocampus CA1 area. (a) Sham group. (b) CIRI group. (c) CIRI + EDB group. (d) KO sham group. (e) KO CIRI group. (f) KO CIRI + EDB group (magnification, ×400)
