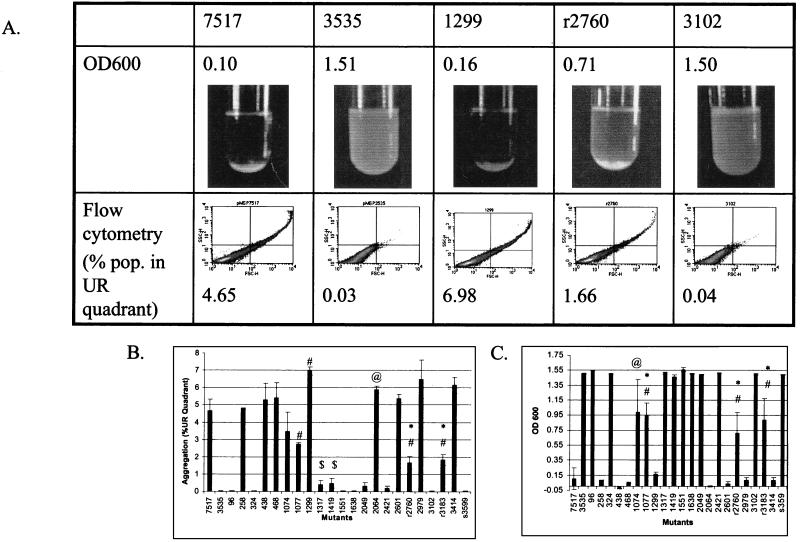
FIG. 3.
Aggregation of the mutants was measured by spectrophotometry and flow cytometry. Representative data for Asc10+ (7517), the vector control (3535), a functional mutant (1299), intermediate mutant (r2760), and a nonaggregating mutant (3102) are shown. UR, upper right. (A). The aggregation of the mutants was measured by flow cytometry as a percentage of the induced populations in the (UR) quadrant (B). The OD600 of induced cultures after 1 h of settling was also determined (C). A decrease in OD600 indicates aggregation. #, P < 0.05 from 7517; @, P < 0.1 from 7517; ∗, P < 0.05 from 3535; $, P < 0.1 from 3535.

