FIGURE 5.

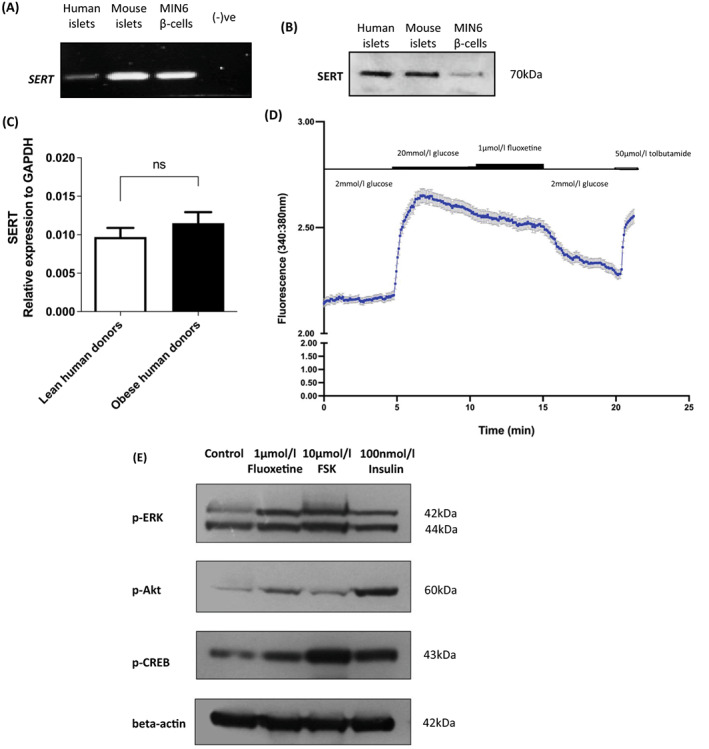
Possible mechanisms of actions of fluoxetine in beta cells. Products of PCR using cDNA from human islets, mouse islets and MIN6 beta cells, and species‐specific primers for SERT were electrophoretically separated on 1.8% agarose gels. Non‐reverse‐transcribed RNA was used as a negative control (A). 50 μg protein lysates from human islets, mouse islets and MIN6 beta cells were separated on a 10% polyacrylamide gel and SERT protein expression was detected by Western blot analysis (B). SERT mRNA expression was quantified in islets isolated from lean (body mass index [BMI] 21.0 ± 1.5 kg/m2) and obese (BMI 31.3 ± 0.3 kg/m2) donors and expressed relative to GAPDH mRNA (C). Real‐time changes in intracellular calcium in response to exposure to 20 mmol/L glucose, 1 μmol/L fluoxetine and 50 μmol/L tolbutamide were recorded in Fura‐2‐loaded dispersed mouse islet cells (D, mean ± SEM, n = 50 cells). MIN6 cells were incubated with 1 μmol/L fluoxetine or vehicle (0.005% v/v DMSO) for 24 hours before Western blotting for phosphorylation of ERK (p‐ERK), Akt (p‐Akt) and CREB (p‐CREB) using antibodies against the phosphorylated forms of the corresponding proteins. Levels of protein phosphorylation in response to fluoxetine were compared to those induced by 10‐minute exposure of MIN6 beta cells to 10 μmol/L forskolin or 100 nmol/L insulin. Expression of beta actin was used as loading control (E). Data are representative of two (for phospho‐Akt) or three (for phospho‐ERK and phospho‐CREB) different experiments
