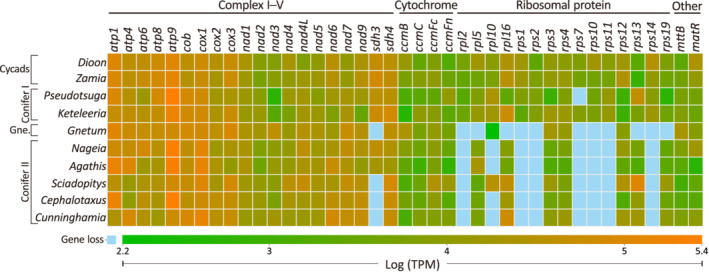
Figure 1.

Comparisons of mitochondrial protein‐coding genes and their expression levels among the 10 studied gymnosperms. Gene expression levels are normalized to transcripts per million (TPM) values and represented by a color gradient from green (lowest) to orange (highest). Light‐blue squares specify losses of genes. Gne., gnetophytes.
