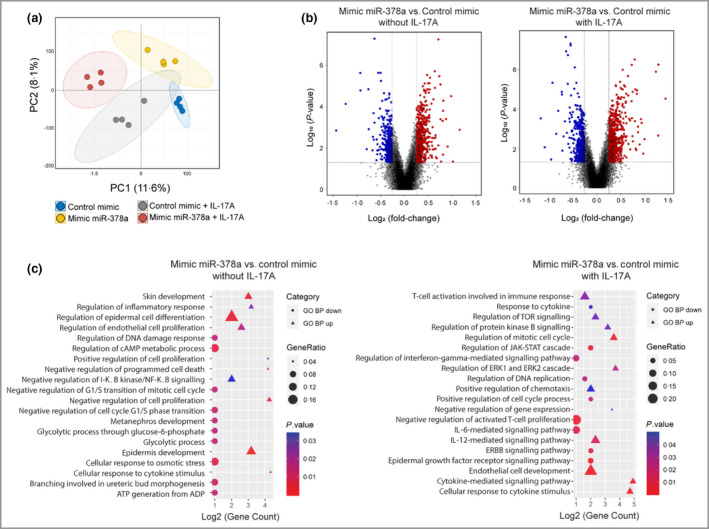
Figure 3.

Transcriptomic changes upon overexpression of miR‐378a in keratinocytes. Keratinocytes were transfected with miR‐378a mimics (to overexpress miR‐378a) or control oligos alone or in combination with interleukin (IL)‐17A treatment, and transcriptome analysis was performed. (a) Principal component analysis of the transcriptome of cultured primary human keratinocytes transfected with control mimic alone (blue dots) or in combination with IL‐17A (grey dots), and transfected with miR‐378a mimic alone (yellow dots) or in combination with IL‐17A (red dots). (b) Volcano plots showing the log2 fold‐change (FC) (vertical grey lines) and the nominal P‐value (grey horizontal line) for all the transcripts detected by the Affymetrix platform in the miR‐378a mimic vs. control mimic group comparison, in the absence (left) and in the presence (right) of IL‐17A. Grey dots indicate transcripts not significantly changed, blue dots represent transcripts with FC < 0·67 and red dots represent transcripts with FC > 1·5. (c) Significantly enriched gene ontology biological processes (GO BP) of miR‐378‐overexpressing keratinocytes treated (right) or not treated (left) with IL‐17A. The shape of the plotted GO BP terms indicate the direction of regulation (circles for upregulated genes and triangles for downregulated genes), the size indicates the percentage of total deregulated genes in the given GO BP term (Gene Ratio) and the colour corresponds to P‐value. TOR, target of rapamycin; cAMP, cyclic adenosine monophosphate; JAK, Janus kinase; STAT, signal transducer and activator of transcription; ERK, extracellular signal‐regulated kinase. [Colour figure can be viewed at wileyonlinelibrary.com]
