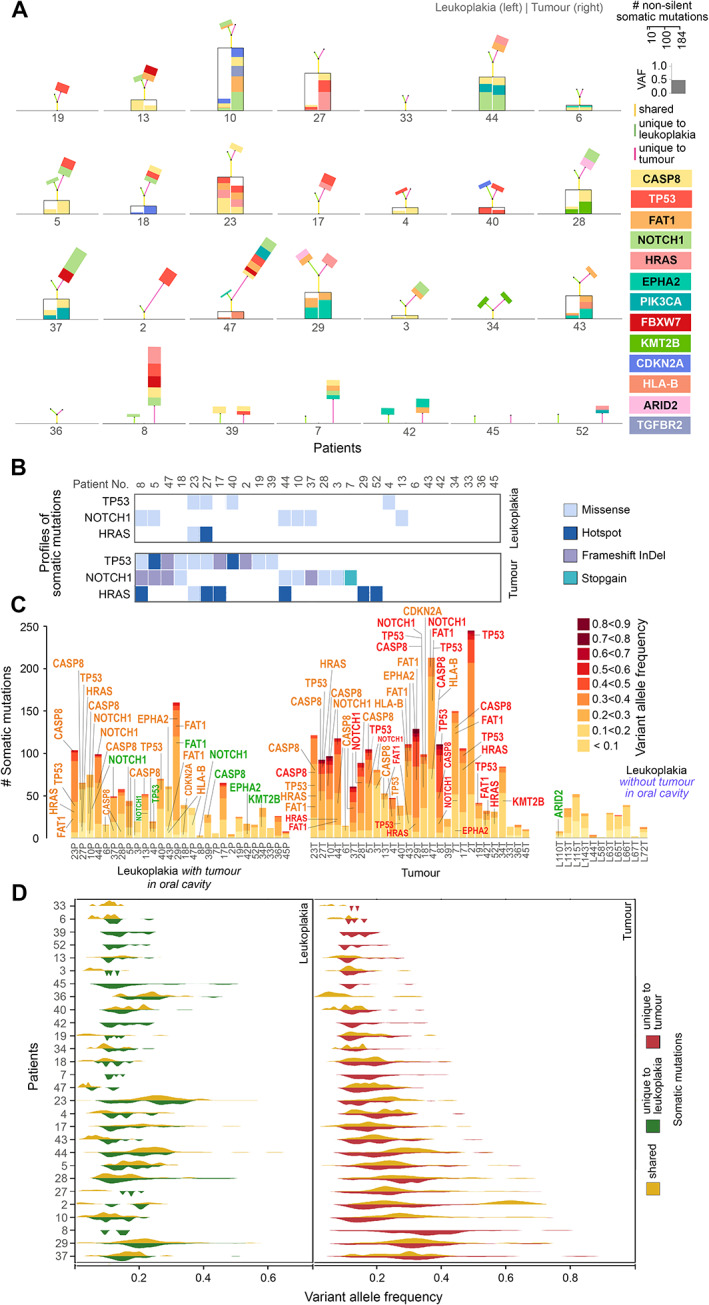
Figure 3.

(A) Landscape of shared and unique somatic mutations in oral cancer driver genes for each patient. The genes are colour‐coded as indicated. The height of the box representing a driver gene mutation is scaled in proportion to its variant allele frequency. Mutations in genes that are shared between tumour (right) and leukoplakia (left) tissues are placed within the black box. Additional unique mutations in the tumour (right) and/or leukoplakia (left) are placed on the top of each box. The heights of the colour‐coded lines (yellow: shared, red: unique to tumour; green: unique to leukoplakia) are proportional to the number of mutations. The angle between the two lines representing the number of unique mutations in leukoplakia (green) and tumour (red) is proportional to the angular distance between them. (B) The number of pathogenic somatic mutations (hotspot, frameshift InDel, and stopgain) in oral cancer driver genes is higher in tumours than in leukoplakia lesions. (C) Numbers of somatic mutations in oral cancer driver genes in various allele frequency classes in (1) leukoplakia lesions, (2) adjacent tumours, and (3) leukoplakia lesions without tumour in the oral cavity. Genes are coloured based on their presence: only in tumour (red), only in leukoplakia lesion (green), and in both leukoplakia lesion and tumour (orange). (D) Allele frequencies (VAFs) of variants in tumours were significantly higher than in leukoplakia tissues, indicative of larger clonal fractions with variants in tumours. The allele frequencies of shared somatic variants were significantly higher than tumour‐ or leukoplakia‐specific variants indicating that those shared mutations originate early during tumorigenesis.
