
FIGURE 8.
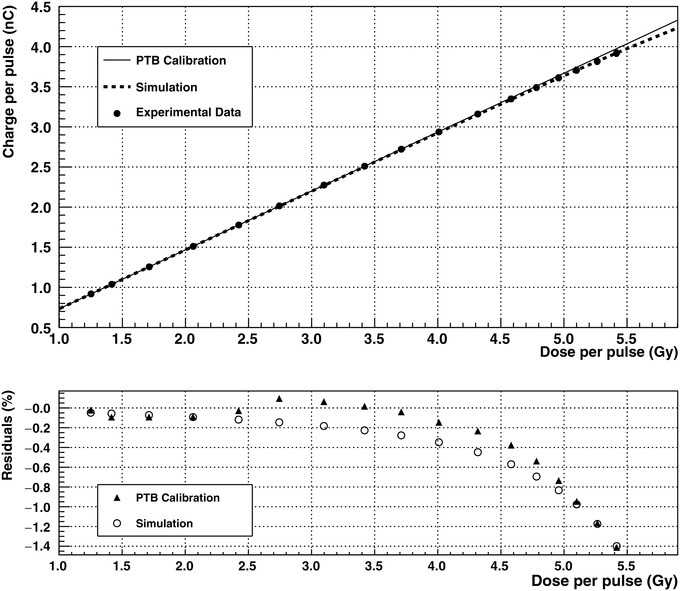
Results obtained at PTB in the water tank for the UTIC1 prototype at +250 V bias voltage. The experimental charge obtained versus dose per pulse is indicated by filled circles in the upper graph. The sensitivity obtained for this chamber was used to extrapolate the ideal linear response at high dose per pulse indicated by continuous line. Dashed line corresponds to expected results from simulation. Residuals expressed in terms of local relative differences are shown below were filled triangles correspond to experimental data and circles to simulation. For simulation, the volume recombination constant α was fixed to 0.42 m 3 s −1