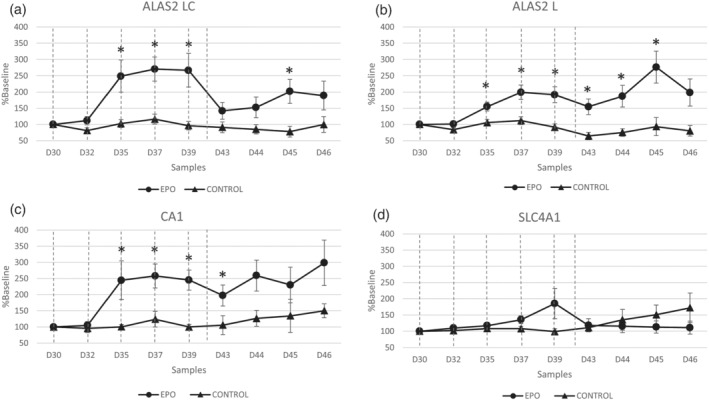
FIGURE 1.

The effects of rhEPO micro‐doses on selected mRNA levels. The levels of ALAS2 LC (a), ALAS2 L (b), SLC4A1 (c), and CA1 (d) mRNAs in DBS samples after rhEPO (treated) or saline (control) microdosing, expressed as a percentage of the baseline values. *P < 0.05 versus control. The dashed lines indicate injections of rhEPO microdoses (900 IU)
