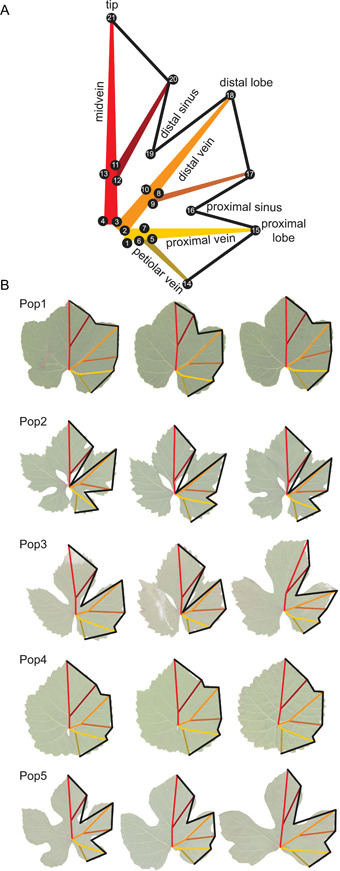
Figure 1.

(A) Schematic diagram of 21 landmarks used in this study to measure leaf shape and size. Major veins are labeled, with branching veins indicated by darker shades. Numbers indicate the order the landmarks were placed. (B) Shape information captured by the 21 landmarks across each of the five populations examined in this study. Three leaves from a single vine are shown from each population. Given the range of lobing within an individual population (Appendix S4), the leaves shown are not representative of an individual population, but rather, the variation in lobing across all populations.
