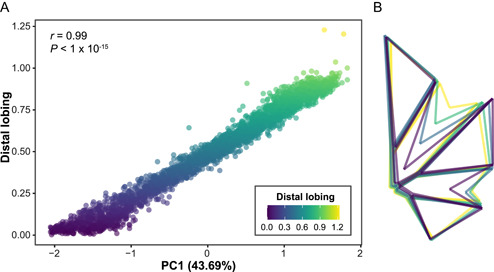
Figure 2.

(A) Correlation between principal component 1 (PC1) and distal lobing. Each leaf (n = 2632) is plotted with the color of the point indicating the distal lobing value. Distal lobing values were calculated as the ratio of the length of the distal sinus to the length of the distal lobe terminus, with values increasing as lobing decreases. The Pearson's correlation coefficient between PC1 and distal lobing is indicated, as is the amount of variance explained by PC1. (B) For each PC1 quartile, a mean leaf is plotted and colored according to distal lobing value.
