
FIGURE 3.
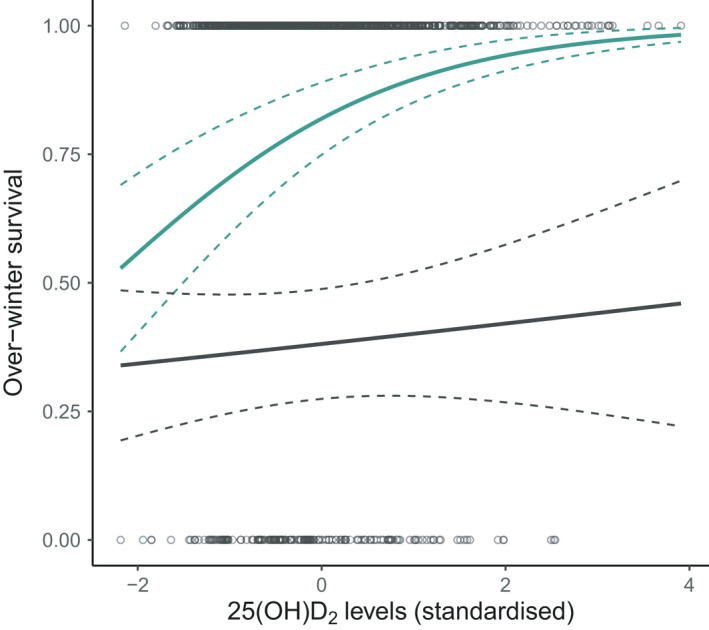
Scatterplot of raw data and general linear model predictions for associations between vD2 (25(OH)D2) concentrations (standardized, for full details see Section 2) and subsequent over‐winter survival probability for adult female (green) and male (grey) Soay sheep. The slope is predicted from the model with both sexes (Table S10) with other fixed effects set as follows: yearling age group, dark coat colour, the year 2011 and average weight. The dashed lines represent standard errors