
Fig. 2.
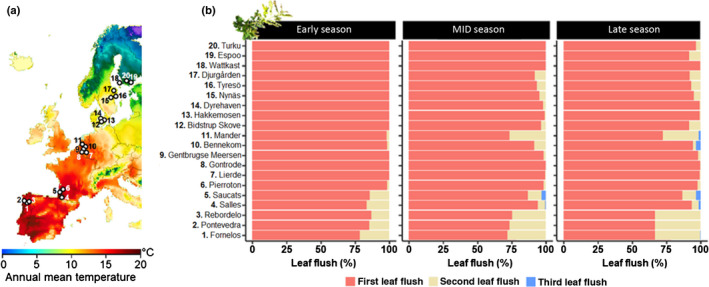
Overview of the location of the study populations and relative abundance of the different oak leaf flushes (Quercus robur). (a) Map of Europe with the location of the 20 sampled populations (circles), with the colour gradient indicating annual mean temperature (data source: Copernicus). (b) The percentage of shoots that belong to the first, second and third leaf flush, separately for each population during the early, mid and late season.