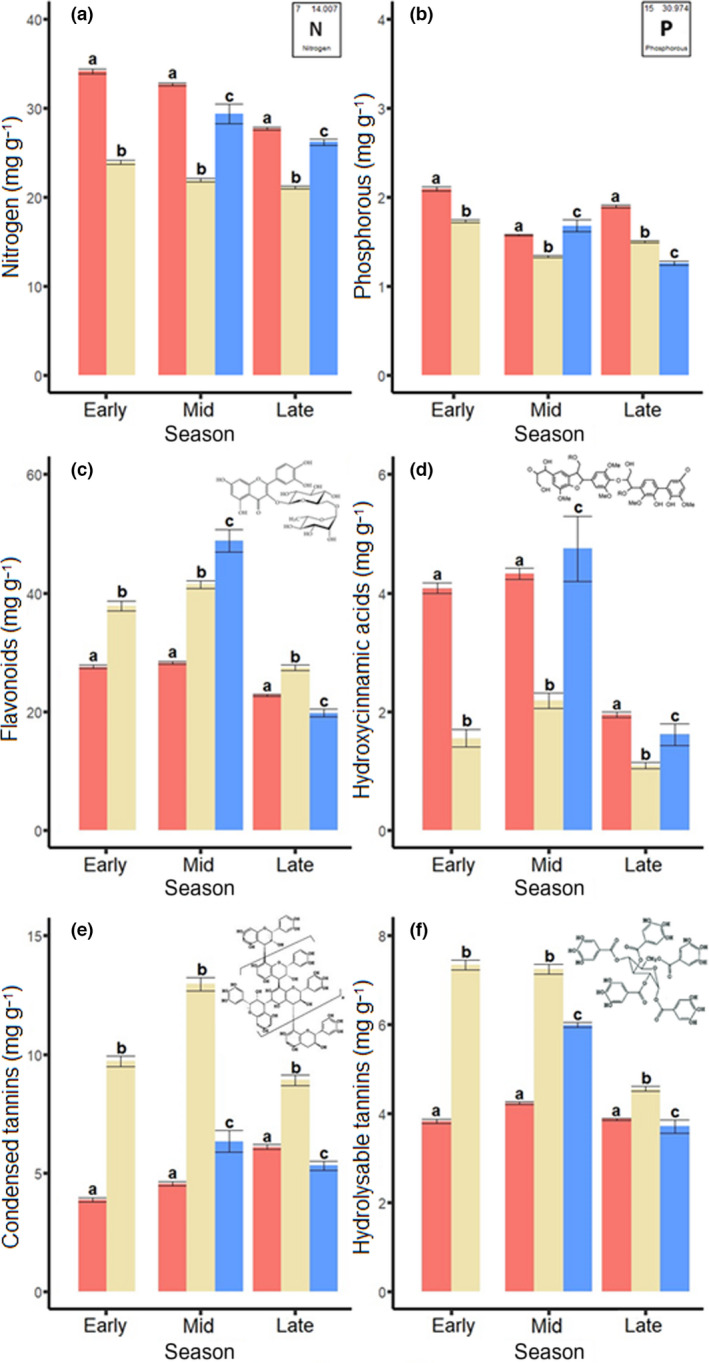
Fig. 3.

Differences among oak leaf flushes (Quercus robur) in the concentration of primary compounds (a) nitrogen and (b) phosphorus and secondary compounds (c) flavonoids, (d) hydroxycinnamic acids, (e) condensed tannins and (f) hydrolysable tannins during the early, mid and late season. Concentrations are expressed in mg g−1 of dry tissue. Bars represent means and error bars represent standard errors. Significant differences among leaf flushes in each season are indicated by different letters above bars (P < 0.05), with statistical details provided in Supporting Information Table S25.
