
Figure 1.
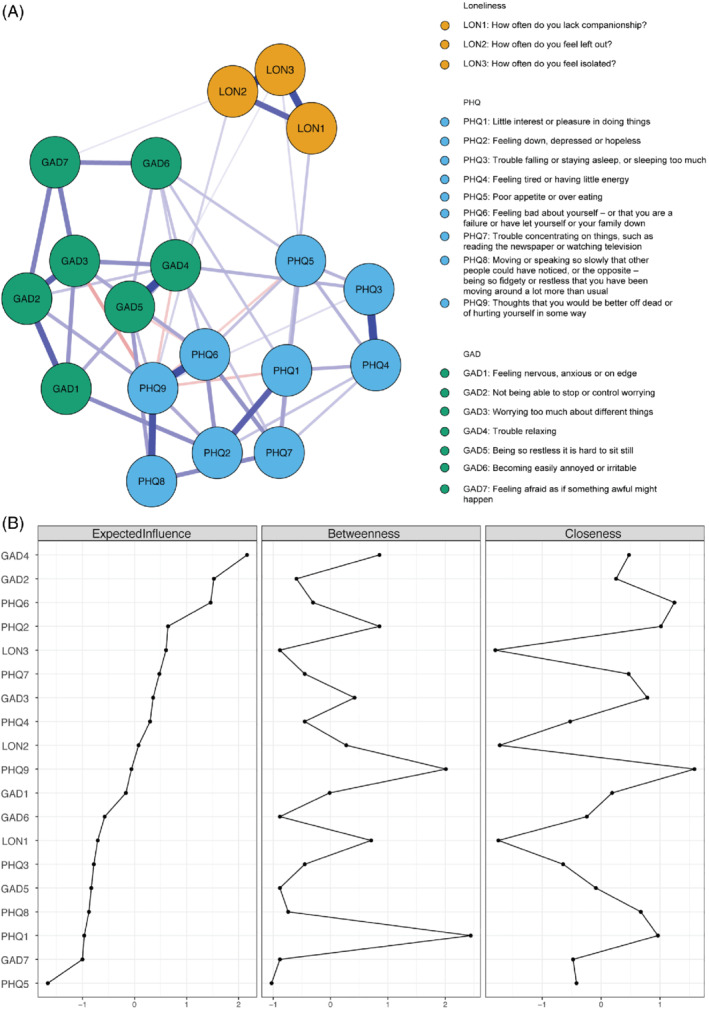
(a) Visualised network. Note: Blue edges represent positive associations and red edges represent negative associations between nodes. (b) Standardised Centrality measures. Note: Values for centrality are standardised and sorted from least to most Expected Influence.