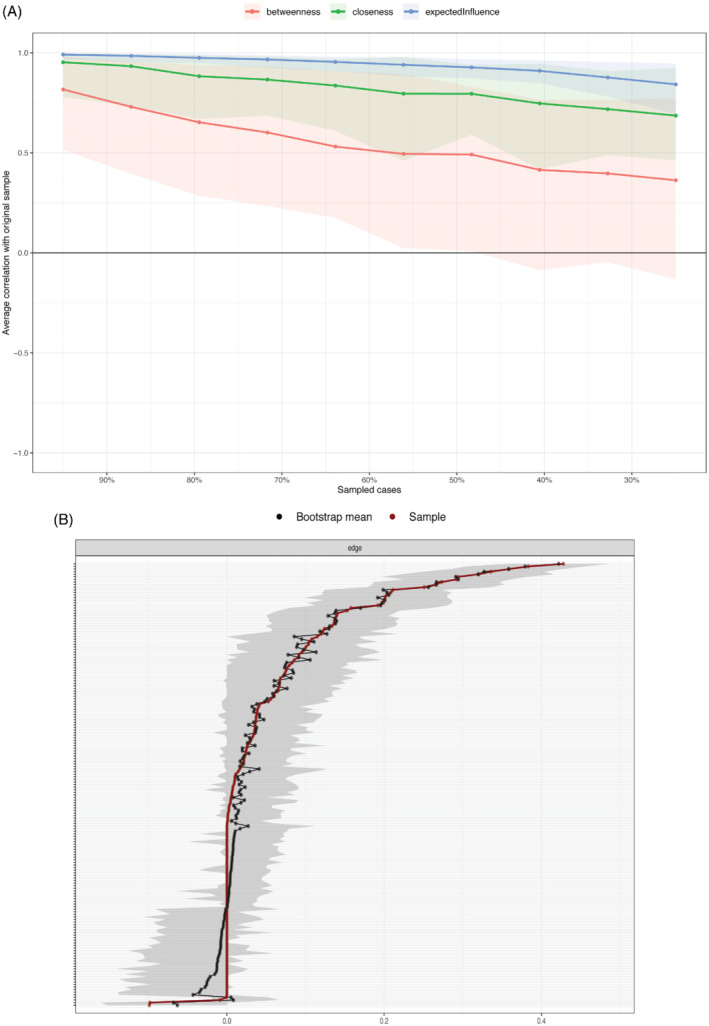
Figure 2.

(a) Case‐drop stability analysis. Note: Mean correlations between centrality values of original sample and bootstrapped sub samples with different degrees of persons dropped. Lines reflect means and areas around the lines reflect 95% CIs. (b) Network Stability. Note: The red line represents the edge, as estimated in the sample. The grey indicates 95% bootstrapped confidence interval. The x‐axis represents the edges, while specific edges are denoted along the y‐axis by the grey lines.
