
Figure 4.
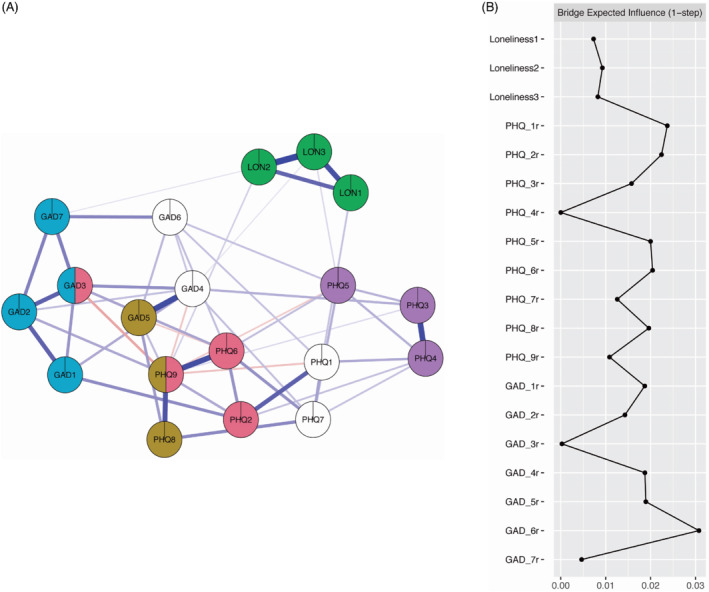
(a) Clique Percolation. Note: Colours reflect the Clique percolation community analysis results with white nodes indicating a node does not belong to any community. (b) Bridge expected influence. Note: Values for Bridge Expected Influence are standardised.