FIGURE 2.

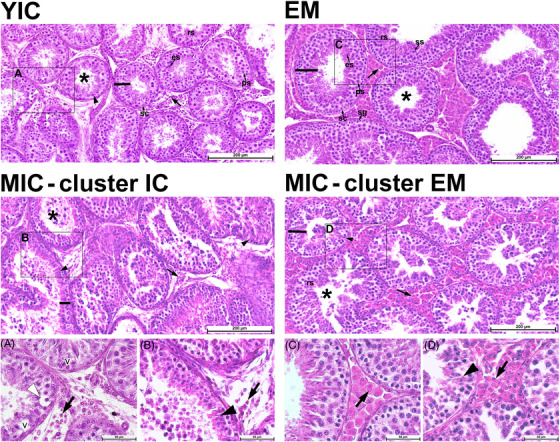
Representative photomicrographs composed of six adjacent image frames of testis cross‐sections showing the seminiferous tubules and interstitial Leydig cells of young (upper row panels) and mature ICs (MICs; middle row panels) boars, as well as higher‐magnification images of the areas marked with black rectangles (lower row panels A–D). Shown are young ICs (YICs; animal No. 14) and entire male (EMs; animal No. 4) boars as positive and negative controls, respectively. MICs (middle row panels) clustered as ICs (MICs—cluster ICs; animal No. 85) or EMs (MICs—cluster EMs; animal No. 77). The lumen of the seminiferous tubule and the germinal epithelium height are marked with an asterisk and a black line, respectively. A drastic reduction in the number and size of Leydig cells (black arrows) is visible in the YICs (positive control; left upper row panel) and the MICs clustered as ICs (left middle row panel) and in higher‐magnification images (cf. panels A and B with panels C and D). Exfoliation of germ cells is also seen in all three IC groups (YICs, MICs—cluster ICs, and MICs—cluster EMs). Higher‐magnification images show (A) degeneration of spermatocytes (white arrowheads) and signs of seminiferous epithelium vacuolation (v) and (B, D) spermatid heads retention deep within the seminiferous epithelium (black arrowheads). Hematoxylin and eosin staining, scale bar = 200 and 50 µm; sc, Sertoli cell; ps, primary spermatocytes; ss, secondary spermatocytes; rs, round (spherical) spermatids; es, elongated spermatids.
