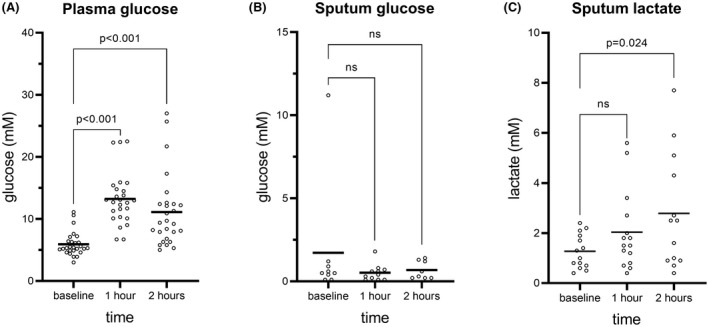
Fig. 1.

Glucose levels in plasma and sputum and lactate levels in sputum during fasting and 1 and 2 h after oral intake of glucose. The number of samples in A was 27 at baseline, 26 at 1 h, and 27 at 2 h. The number of samples in B was 9 at baseline, 11 at 1 h, and 8 at 2 h. The number of samples in C was 14 at baseline, 15 at 1 h, and 13 at 2 h. The means are marked by black lines. Data were analyzed using one‐way ANOVA test followed by Bonferroni's multiple comparisons correction. p < 0.05 was considered significant.
