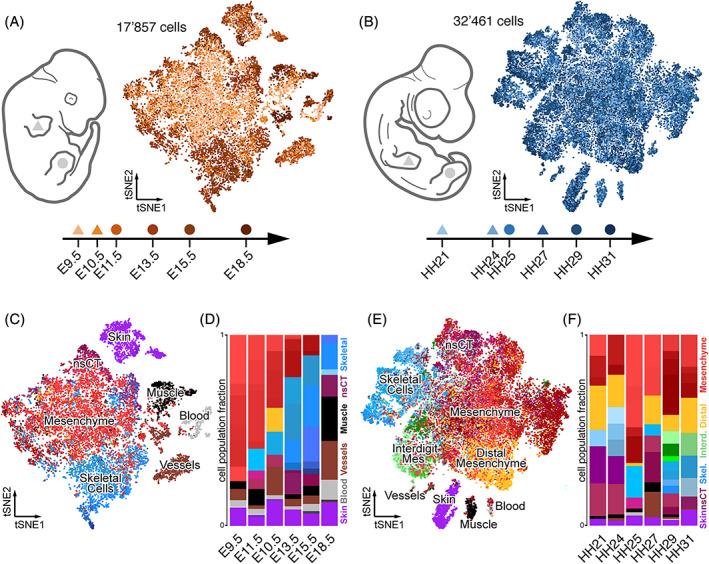
FIGURE 1.

Comparative single‐cell transcriptomic atlases of the developing mouse and chicken limb. A and B, Sampling schemes and tSNE projections of 17 857 mouse (A) and 32 461 chicken (B) forelimb (triangle) and hindlimb (circle) single cell transcriptomes. C–F, Mouse (C) and chicken (E) cluster identities are highlighted by color codes in the tSNE projections, on a cell‐by‐cell basis, with cells belonging to similar tissue types sharing color codes across all samples. Relative sample composition is visualized by barplots (D, F). A total of 86 and 74 clusters were identified in mouse and chicken, respectively, distributed over six sampling time points
