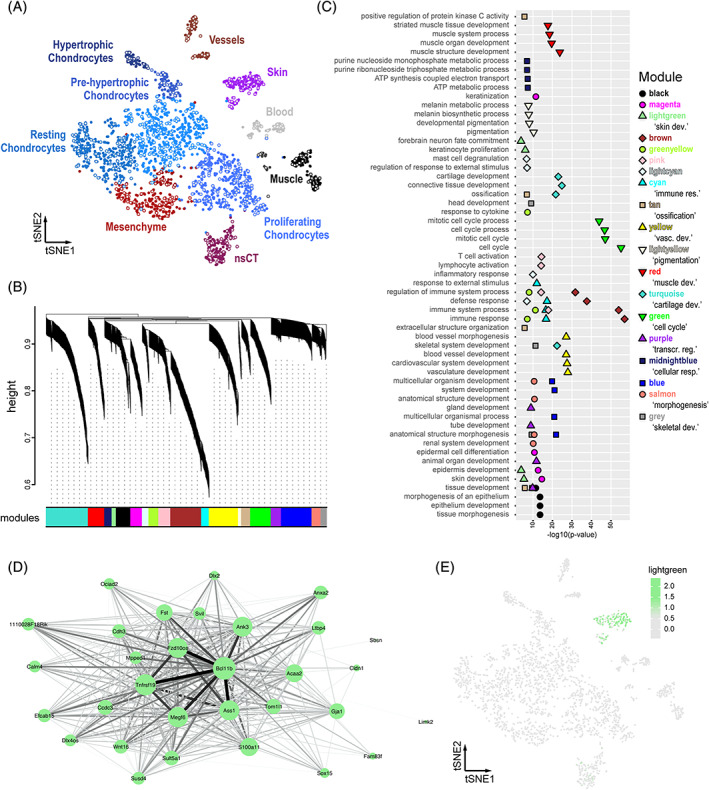
FIGURE 2.

A bioinformatics workflow for iterative gene co‐expression module detection and identification. A, tSNE projection of the mouse E15.5 sample used as reference for iterative WGCNA gene co‐expression module detection. Identified clusters are color‐coded and labeled, with seed cells used for pseudocell construction highlighted in grey. B–E, Sample outputs of our “scWGCNA” package. B, Final WGCNA gene hierarchical clustering dendrogram, showing 19 modules of co‐expression. C, Cumulative results of GO‐term enrichment analyses, showing the top 4 (by P‐value) enriched GO‐terms for each module. D, Cytoscape visualization of co‐expression module “lightgreen.” Node size for each gene is proportional to its module membership, edge thickness and intensity represent topological overlap. E, E15.5 tSNE showing the averaged cellular expression of module “lightgreen.” GO, gene ontology; WGCNA, weighted gene correlation network analysis
