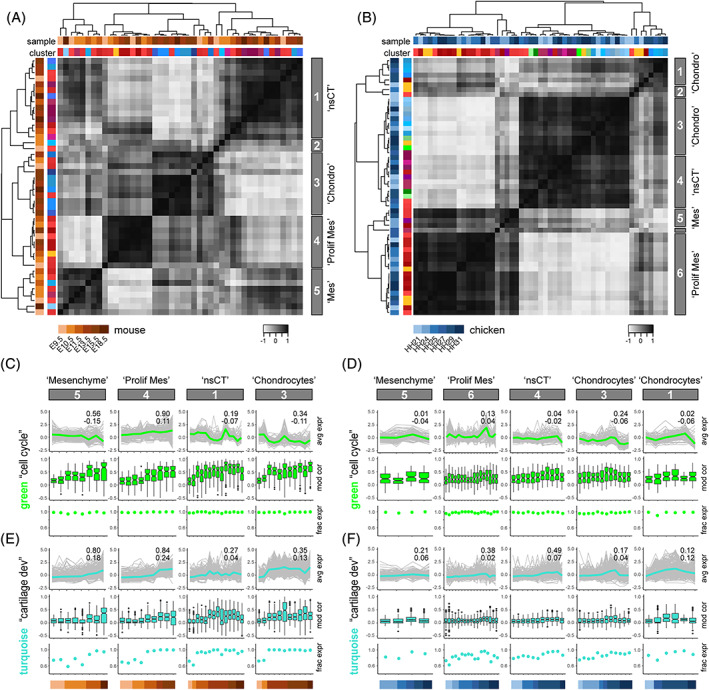
FIGURE 4.

Comparative developmental transcriptome trajectories in homologous cell populations. A and B, Heat maps of Pearson's correlation coefficients and hierarchical clustering based on pairwise Euclidian distances, calculated on averaged expression of selected modules, for mouse (A) and chicken (B) lateral plate mesoderm‐derived cell population pseudobulks. Top row of cluster identifiers is color‐coded for species and developmental stage, bottom row for tissue type to which the respective cluster was attributed to, based on marker gene expression. The five (A, mouse) and six (B, chicken) major clusters emerging, based on tree height, are highlighted on the right with grey boxes. C–F, Developmental trajectories of scaled averaged module expression in ontogenetically ordered pseudobulks, separated by “tissue‐like” clusters identified in A and B. Embryonic stage of each pseudobulk is color‐coded at the bottom, for mouse (C, E) and chicken (D, F). Scaled averaged modules expression trajectories shown in the respective module color, with individual module gene traces underlaid in grey. Superimposed on each trajectory, a coefficient of determination (R 2) of the individual traces (top), as well as the slope of a linear regression (bottom) is provided. Boxplots below indicate the pseudobulk‐wise distribution of the gene‐by‐gene Pearson's correlations to the average module expression across the respective pseudocells. Additionally, the fraction of genes expressed, as defined by a variance >0 in each pseudobulk, is represented by dot‐plots
