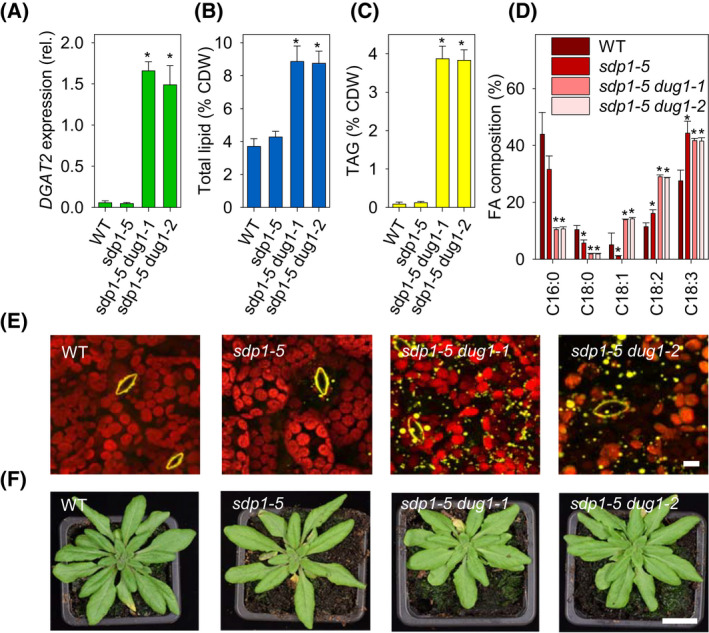
Fig. 2.

Effect of promoter fusion on lipid metabolism in rosette leaves of 7 weeks old plants. (A) Expression of DGAT2 in leaves of dug1‐1 and dug1‐2 in the sdp1‐5 background. (B) Total leaf lipid content and (C) TAG content, as percentage of cell dry weight (CDW). (D) Fatty acid composition of TAG. C16:0, palmitic acid; C18:0, stearic acid; C18:1, oleic acid; C18:2, linoleic acid; C18:3, linolenic acid. In A–D, data are presented as mean ± SE (n = 3) and asterisks denote values significantly (P < 0.05) different from WT (ANOVA + Tukey HSD test). (E) LSCM images of lipid droplets accumulating in leaves. Leaf sections were harvested ~ 6 h after dawn. Lipid droplets and guard cell cuticular ledges yellow (Nile red stained) and chloroplasts red (chlorophyll florescence). (F) Images of whole rosette plants. In E and F, the analyses were performed on multiple plants of each genotype (n = 3) and individual representative images are presented. Scale bars in E and F are 10 µm and 2 cm.
