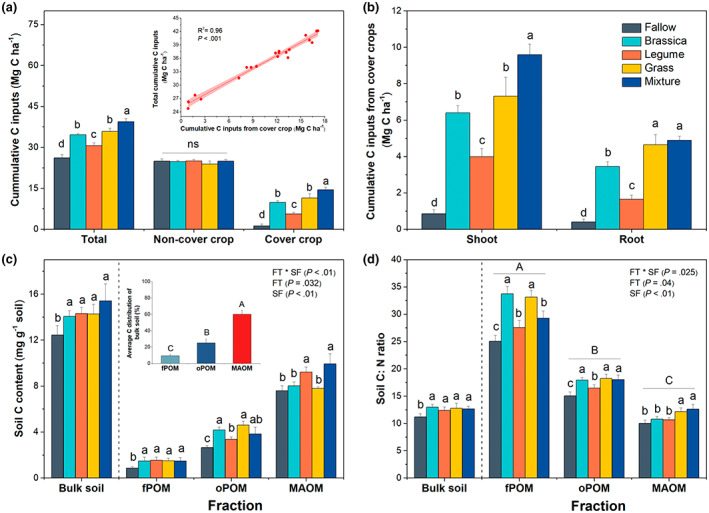
FIGURE 1.

Cumulative C inputs (a, b), organic C content (c), and C:N ratio (d) of soils under different cover crop (CC) treatments during the 7‐year organic grain rotation from 2012 and 2019; (a) cumulative C inputs from non‐CCs and CCs; (b) shoot and root cumulative C inputs from CCs; (c) organic C content (mg g−1 soil) and (d) C:N ratio of bulk soil, free particulate organic matter (fPOM), occluded particulate organic matter (oPOM), and mineral‐associated organic matter (MAOM). The inserted plot in (a) shows the linear relationship between the CC cumulative C inputs and the total cumulative C inputs. The inserted plot in (c) shows the average C distribution of fPOM, oPOM, and MAOM in bulk soil. In the main plot of (c), error bars are ±1 SE of the mean (n = 4) with lowercase letters above bars indicating significant differences among CC treatments in bulk soil or specific fraction at p < .05. In the inserted plot of (c), error bars are ±1 SE of the mean (n = 20) with uppercase letters above bars indicating significant differences among soil fractions across all CC treatments at p < .05. In (a) and (b), error bars are ±1 SE of the mean (n = 4) with lowercase letters above bars indicating significant differences among CC treatments at p < .05. In (d), different uppercase letter above bars indicates significant differences among soil fractions across all CC treatments at p < .05. FT, functional type; FT × SF, interaction effect of functional type and soil fraction; ns, non‐significant; SF, soil fraction.
