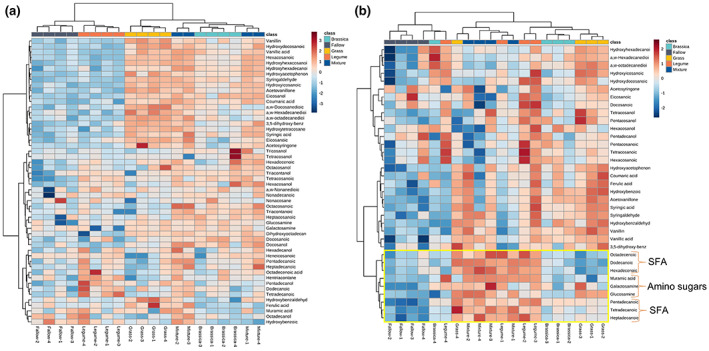
FIGURE 2.

Heatmap and two‐way hierarchical clustering of the concentrations of all identified soil biomarkers in (a) occluded particulate organic matter (oPOM) and (b) mineral‐associated organic matter (MAOM) of soils under different cover crop (CC) treatments. Each column represents a sample from a specific CC treatment, and each row represents a positively identified soil biomarker based on mass spectrum information. The red and blue colors in different cells indicate relatively higher and lower concentrations of specific biomarkers in each sample, respectively. In (b), biomarkers belonging to short‐chain fatty acids (SFA) and amino sugars are highlighted, showing a dominant separation of soil organic carbon chemical composition in MAOM between CC treatments based on microbial‐derived biomarkers.
