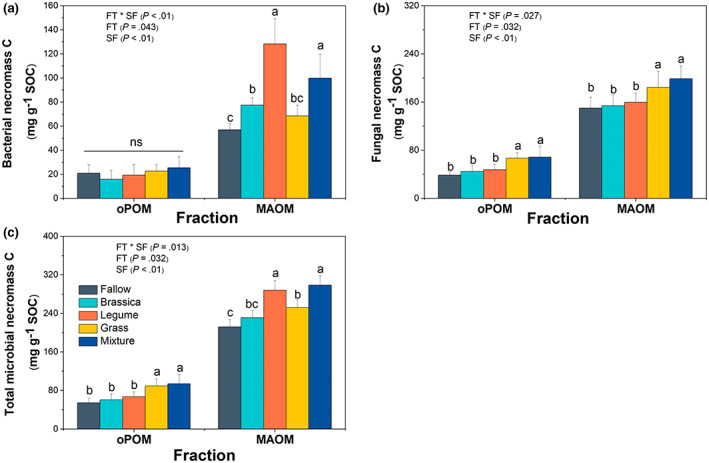
FIGURE 4.

The concentrations of bacterial necromass C (a), fungal necromass C (b), and total microbial necromass C (c) (per gram organic carbon in soil fractions) in oPOM and MAOM. Error bars are ±1 SE of the mean (n = 4) with lowercase letters above bars indicating significant differences among CC treatments in specific fraction at p < .05. CC, cover crop; FT, functional type; FT × SF, interaction effect of functional type and soil fraction; MAOM, mineral‐associated organic matter; ns, non‐significant; oPOM, occluded particulate organic matter; SOC, soil organic carbon; SF, soil fraction.
