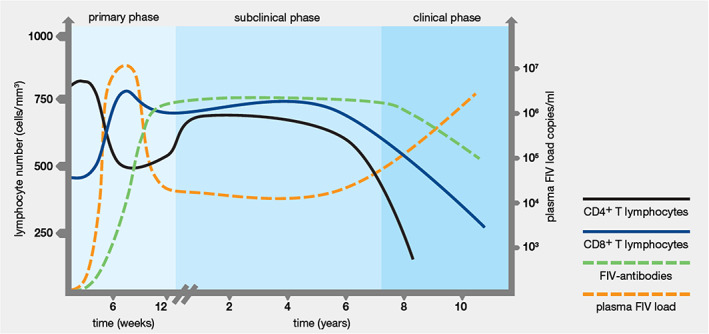
Figure 3.

Changes in the levels of FIV antibody, virus, CD4+ T lymphocytes and CD8+ T lymphocytes during the different phases of FIV infection in cats. The x‐axis shows the timescale in weeks for the primary phase, and in years for the subclinical and clinical phases. The left y‐axis shows CD4+ and CD8+ T lymphocyte numbers (cells/mm3). The right y‐axis shows the plasma viral load. Figure kindly supplied by Dr Navapon Techakriengkrai, Department of Veterinary Microbiology, Faculty of Veterinary Science, Chulalongkorn University, Thailand.
