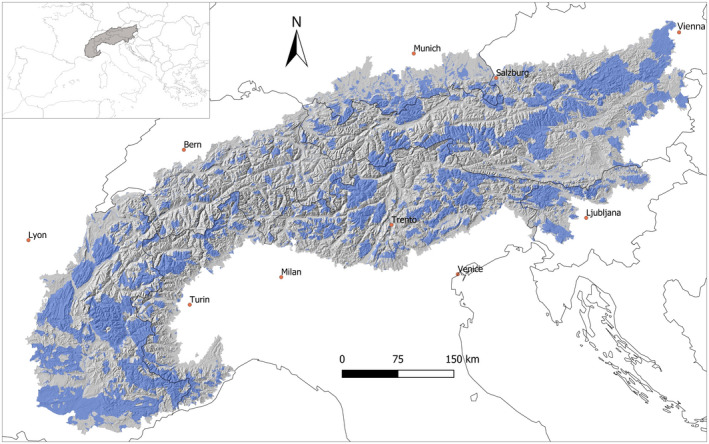
FIGURE 2.

Study area showing the Alpine relief (hillshade based on the digital elevation model used for modeling, see Section 2 for details) and some main cities (boundaries: Alpine Convention area; shapefile produced by the Permanent Secretariat of the Alpine Convention and available on https://www.atlas.alpconv.org/). The top left inset shows the position of the study area within Southern Europe; blue polygons show the distribution of protected areas (all types of protected areas, covering 33.4% of the study area; extracted from World Database on Protected Areas, see Section 2 for details) within the Alps
