Fig. 1.

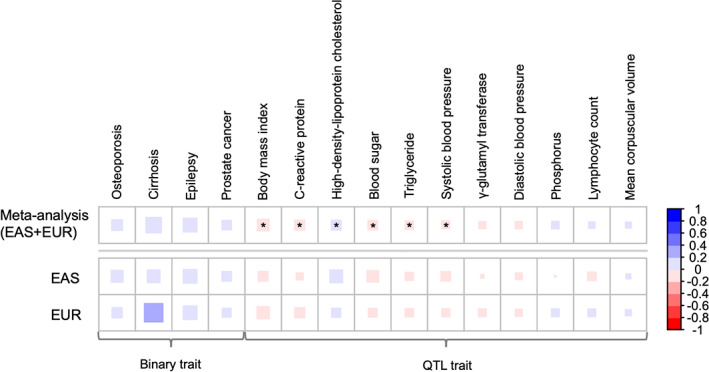
Heatmap of genetic correlation analysis with P‐values <0.1 (for overall samples). The colored box indicates the genetic correlation matrix (rg). Asterisk indicates q‐values <0.05. EAS, East Asian; EUR, European.

Heatmap of genetic correlation analysis with P‐values <0.1 (for overall samples). The colored box indicates the genetic correlation matrix (rg). Asterisk indicates q‐values <0.05. EAS, East Asian; EUR, European.