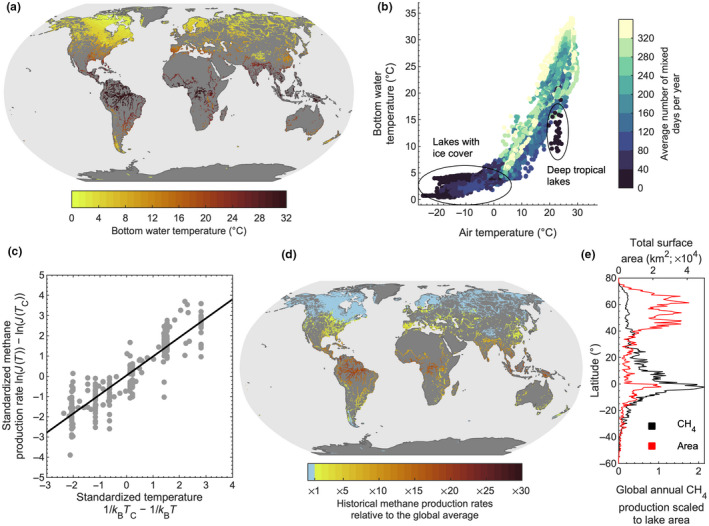
FIGURE 1.

Historical simulations of annual mean bottom temperature and methane production rates in lake sediments. Shown are the historical, averaged over all years from 1970 to 1999 (a) spatial patterns in simulated annual (i.e., annual averages of the daily data) lake bottom temperatures and (b) the relationship between local (defined as the 0.5° grid cell in which a lake is situated) surface air and bottom water temperature in lakes, and the influence of the average number of mixed days per year (also see Figure S3). Also shown is (c), the temperature dependence of methane (CH4) production rates in lake sediments based on published incubation datasets from 30 unique sites (see Section 2); (d) the spatial patterns in the annual average CH4 production rates in lake sediments relative to the historical global average; and (e) the percentage of global lake sediment CH4 production as a function of latitude. All projections are based on the average simulations across the lake‐climate model ensemble. CH4 production rates are computed as annual averages of daily rates (i.e., using daily bottom water temperatures) to fully resolve the exponential temperature response of methanogenesis.
