
FIGURE 1.
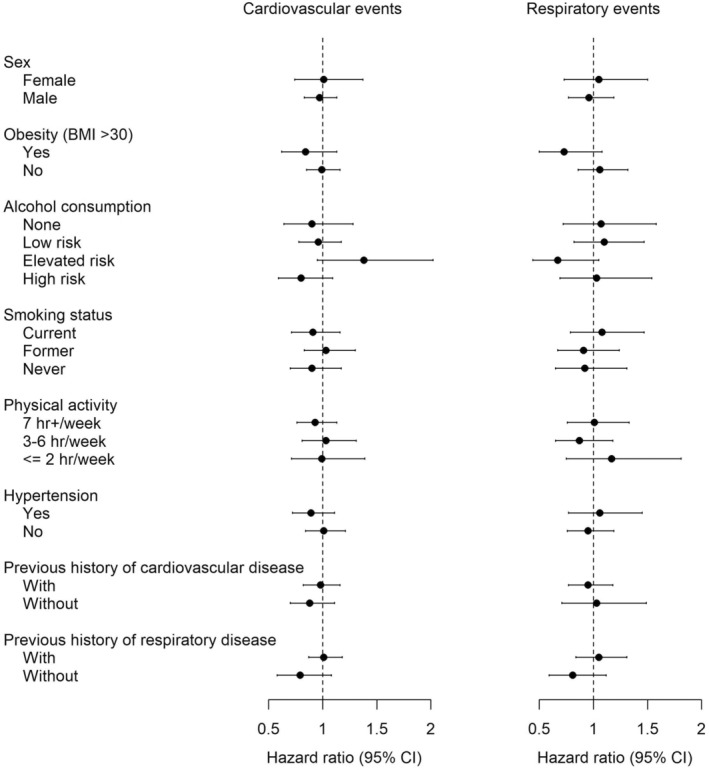
Associations between candle use (>4/week vs. <1/week) and cardiovascular and respiratory events by potential effect modifiers. Model adjusted for age (time scale), sex, baseline year, cohort indicator, marital status, household income, obesity status, alcohol consumption, smoking status, and physical activity.