Figure 2.

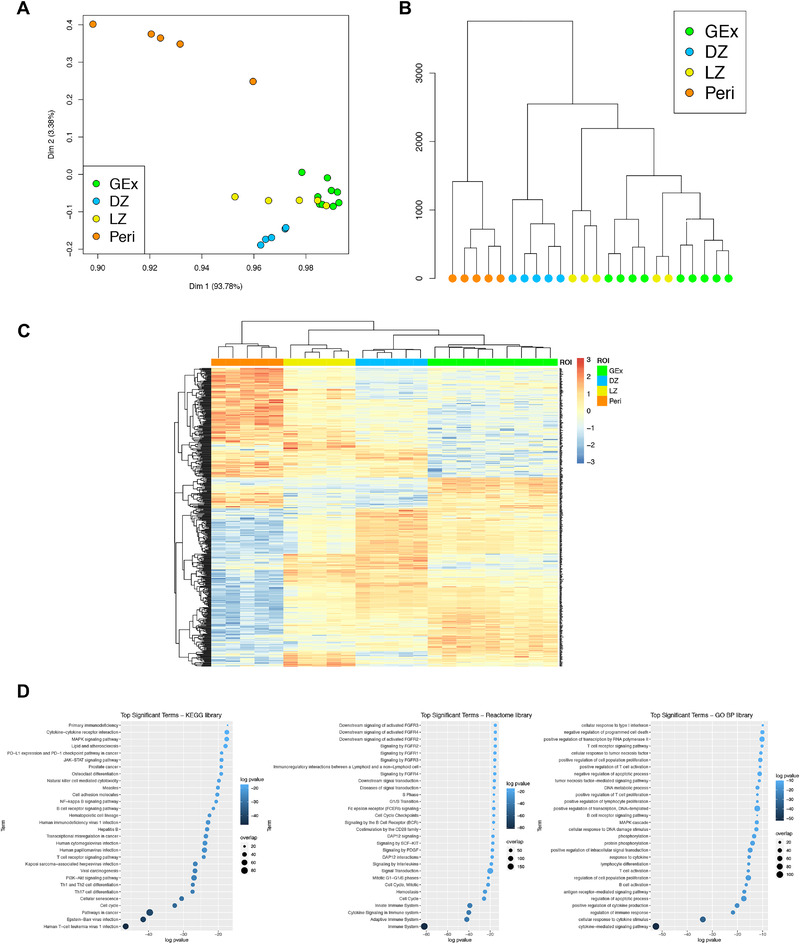
(A) Two‐dimensional principal component reduction of the DZ (n = 5), LZ (n = 5), Peri (n = 5), and GEx (n = 9) regions of interest (ROIs) profiles according to Digital Spatial Profiling of 1824 genes. (B) Unsupervised hierarchical clustering of the 24 ROIs. (C) Heatmap of differentially expressed genes among GEx, DZ, LZ, and Peri ROIs. Kruskal–Wallis test has been applied to compare gene expression among ROI groups. (D) Top significant terms from gene set enrichment analysis on genes differentially expressed among DZ (n = 5), LZ (n = 5), Peri (n = 5), and GEx (n = 9) ROIs (Gene Ontology Biological Process, KEGG, and Reactome Pathway libraries).
