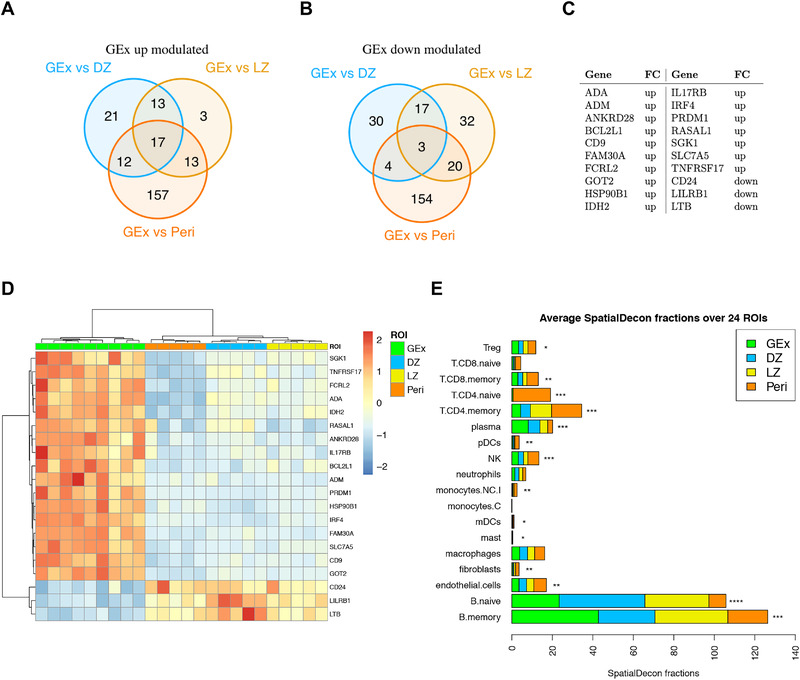
Figure 3.

(A) Venn diagram of upmodulated genes from three different comparisons (i.e. GEx vs. DZ, GEx vs. LZ, and GEx vs. Peri). (B) Venn diagram of downmodulated genes from three different comparisons (i.e. GEx vs. DZ, GEx vs. LZ, and GEx vs. Peri). (C) GEx signature genes. These genes are significantly differentially expressed in GEx in each pairwise comparison. (D) Heatmap of differentially expressed genes in GEx as compared to DZ, LZ, and Peri ROIs. The GEx signature shows a high discriminatory capacity between GEx ROIs and the other regions. (E) Average Spatial Decon fractions of cell types in the four ROI subgroups; DZ (n = 5), LZ (n = 5), Peri (n = 5), and GEx (n = 9) ROIs. Kruskal‐Wallis test has been applied to compare faction distributions among groups (Supporting information Table S5).
