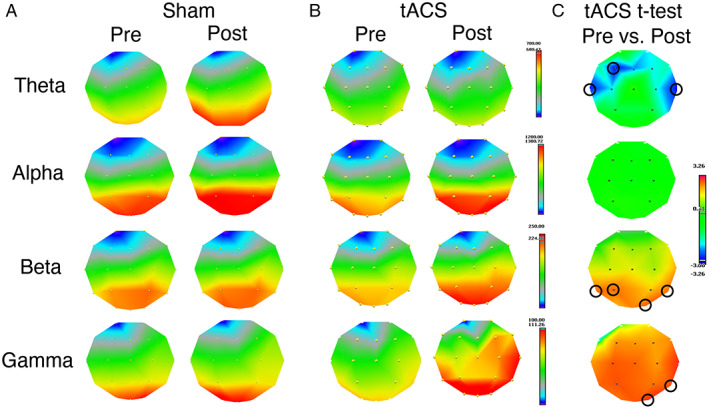
FIGURE 2.

Result of the EEG frequency analysis. Frequency bands: theta (3–6 Hz), alpha (6–12 Hz), beta (12–20 Hz), gamma (20–40 Hz). (A) Power maps pre and post sham stimulation. (B) Power maps pre and post γ‐tACS. (C) t‐Maps of the paired t‐test post vs. pre γ‐tACS. Blue areas indicate a power decrease after γ‐tACS, red areas a power increase. Significant effects at p < 0.05 were found on electrodes F3, T3, and T4 for theta (decrease after γ‐tACS), on electrodes P3, T5, T6, and O2 for beta (increase after γ‐tACS), and on electrodes T4 and O2 for gamma. No effect was found in the alpha band after γ‐tACS and no effect was found on any bands when comparing pre vs. post sham stimulation. Legend: EEG = electroencephalography; tACS = transcranial alternating current stimulation.
