
Figure 6.
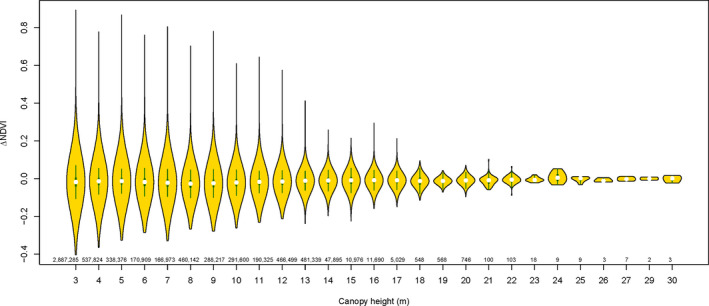
Violin plots showing ∆NDVI distribution across different canopy heights in the Sundarban mangrove forest. The sample sizes (i.e., number of pixels) for each height category are shown in smaller font.
Official websites use .gov
A
.gov website belongs to an official
government organization in the United States.
Secure .gov websites use HTTPS
A lock (
) or https:// means you've safely
connected to the .gov website. Share sensitive
information only on official, secure websites.
Violin plots showing ∆NDVI distribution across different canopy heights in the Sundarban mangrove forest. The sample sizes (i.e., number of pixels) for each height category are shown in smaller font.