FIGURE 2.

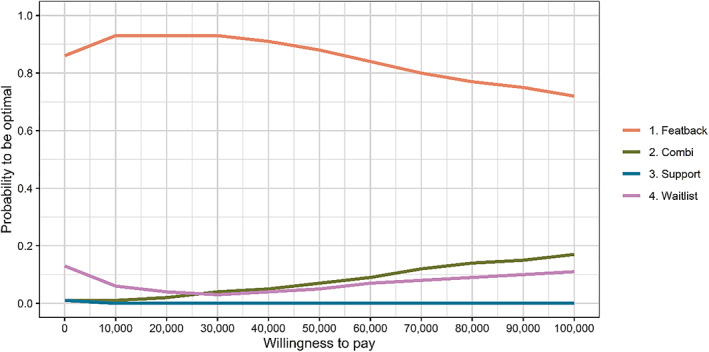
Cost‐capability acceptability curves with ICECAP‐A capability values for the four study conditions derived from 1000 bootstrap samples.

Cost‐capability acceptability curves with ICECAP‐A capability values for the four study conditions derived from 1000 bootstrap samples.