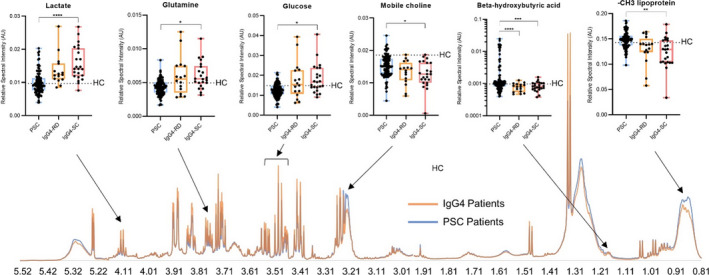
FIGURE 3.

Altered metabolite concentrations indicate a molecular signature of IgG4‐RD compared to PSC. NMR spectra showing median intensity of IgG4 (orange) and PSC (blue) individuals, and box plots of key metabolites. Whiskers indicate min/max values showing all datapoints. Welch’s one‐way ANOVA followed by Dunnett’s post hoc comparisons and Bonferroni’s correction for multiple tests: Lactate (p < .0001), glutamine (p < .05) and glucose (p < .05) were higher in IgG4‐SC patients (n = 23) than in PSC patients (n = 100), while ‐CH3 lipoprotein (p < .01), mobile choline (p < .05), and 3‐hydroxybutyric acid (p < .001) were decreased. Similar trends in metabolite concentrations were observed in IgG4‐RD patients (n = 16) for lactate (p = .055), glutamine (p = .084), glucose (p = .12) and ‐CH3 lipoprotein (p = .051), while 3‐hydroxybutyric acid was also significantly decreased (p < .0001). The dotted line in the univariate plots represents the average healthy control value. p‐values < .05, .01, .001 and .0001 are represented by *, **, *** and ****, respectively
