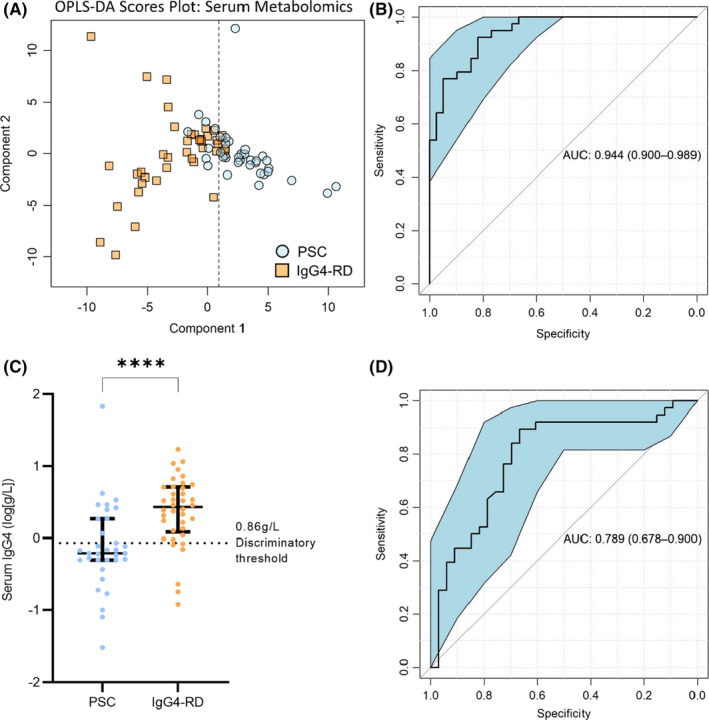
FIGURE 5.

Serum metabolomics remains more specific than IgG4 titre when discriminating IgG4‐RD from PSC in age and sex‐matched patient subgroup. (a) Boxplot of serum IgG4 antibodies in IgG4 disease and PSC patients in age and sex‐matched subgroup (Kolmogorov Smirnov, p < .0001). Median ± interquartile range showing all points. (b) ROC curve for IgG4 titre classifying PSC vs IgG4 disease in matched subgroup. (c) Multivariate scores plot of PSC vs IgG4 disease using serum metabolomic data. (d) ROC curve for serum metabolomic data, classifying PSC and IgG4 disease in the matched cohort. ROC curves show AUC ±95% confidence intervals. N = 39 (PSC) and 39 (all IgG4‐RD). ****p‐values < .0001
