
FIGURE 6.
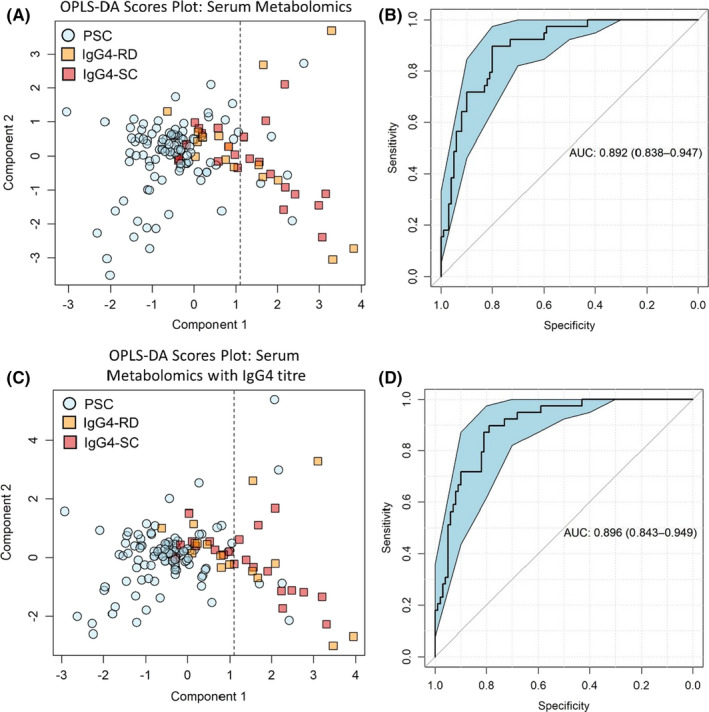
A panel of four serum metabolites retains a high discriminatory capacity. Multivariate scores plot of (a) PSC vs IgG4‐RD and (c) PSC vs IgG4‐SC using only spectral peaks pertaining to beta‐hydroxy butyric acid, lactate, mobile choline and glutamine. (b) ROC curve generated from the three metabolites, classifying PSC vs IgG4‐RD and (d) classifying PSC vs IgG4‐SC. ROC curves show AUC ±95% confidence intervals. N = 100 (PSC) and 39 (all IgG4‐RD)