
FIGURE 2.
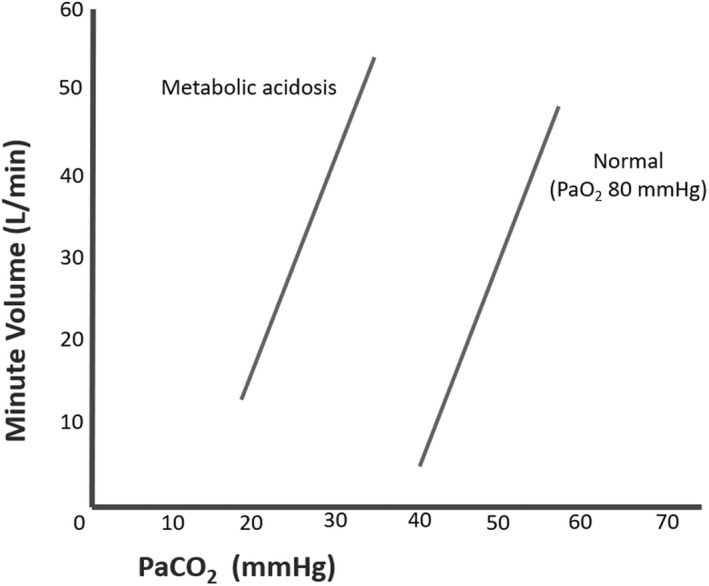
This graph demonstrates the direct ventilatory volume per minute response to the partial pressure of arterial carbon dioxide. The graph shows the dramatic increase in ventilation with increasing arterial pCO2 and the greater need to ventilate at lower arterial pCO2 levels during acidosis (see Reference [64], Yartsev; Reference 68, Levitsky, p. 219; Reference [56], West & Luks, p. 161)