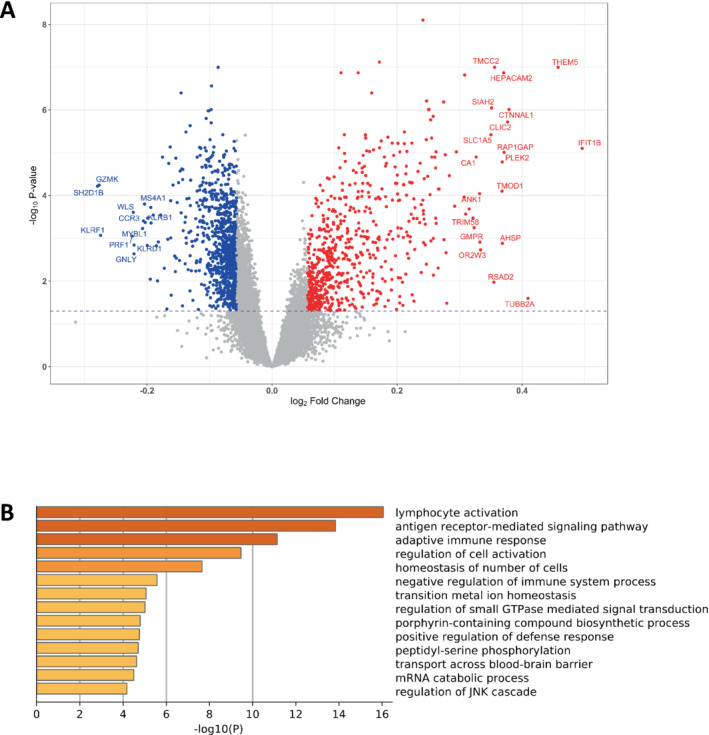
Figure 1.

Differential gene expression and biological process gene ontology analysis. (A) A volcano plot of the differential gene expression pattern between groups, calculated using limma and the following model: ENSG ∼ Age + Sex + log(sum T‐cells) + log(sum B‐cells) + log(neutrophils) + log(basophils) + group. (B) Global gene ontology (biological processes) analysis carried out using Metascape and the list of 1153 differentially regulated genes. The 17 748 detected protein‐coding genes were used as the background and the pre‐analysis settings were: threshold >2.0 and non‐adjusted p‐values threshold p < 0.0001. The plot x‐axis is p‐values (log base 10) while the displayed categories had a false discovery rate of 1.4% or better (see online supplementary Table S2 ).
