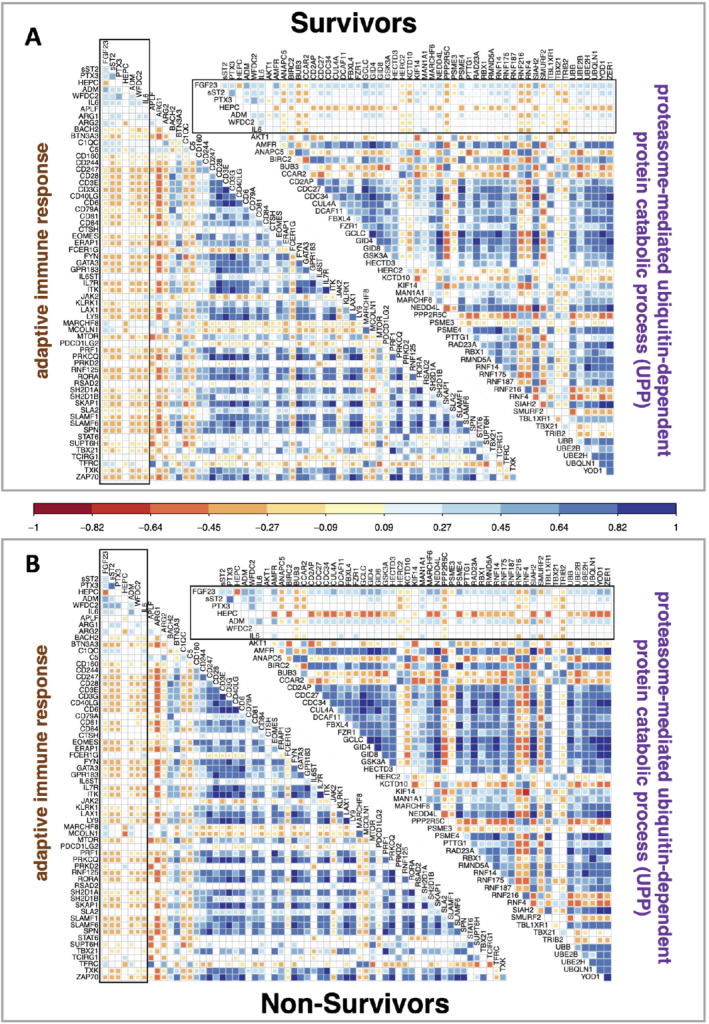
Figure 3.

Top gene ontology pathway gene and protein biomarkers inter‐relationships. Gene expression was correlated with the top protein biomarkers using Pearson correlation coefficients for the two largest significant pathways ‘adaptative immune response’ and ‘proteasome‐mediated ubiquitin‐dependent protein catabolic process’ – the other three top ranked gene ontology pathways are presented in online supplementary Figure S6 . The protein values are enclosed by a black oblong box. Data are plotted separately (grey boxes) for survivors (n = 626) and non‐survivors (n = 318). Correlation values are represented by colour and are plotted for significant correlations (Bonferroni corrected threshold, p < 1.5 × 10⁻⁴).
